


GBPAUD has been carving out a descending triangle pattern since early July, with lower highs connected by a downward-sloping trend line while price finds consistent support around the 1.9059 mark.
The pair is currently testing this horizontal floor once again, and how it behaves here could determine the next major move.
If the support level holds, GBPAUD could bounce higher and test the descending trend line resistance near current price around 1.9119, or possibly stage a larger recovery if bullish momentum builds.
A break above the trend line could also negate the bearish triangle setup and open the door to a move back toward the 1.9200 or 1.9300 major psychological handles.
On the other hand, a confirmed break below the 1.9059 support could validate the descending triangle and set off a drop of the same height as the formation, potentially dragging GBPAUD toward the 1.8900 area or lower. This is often the more probable resolution for descending triangles, though it isn’t guaranteed until confirmed by an actual break and close beneath the support.
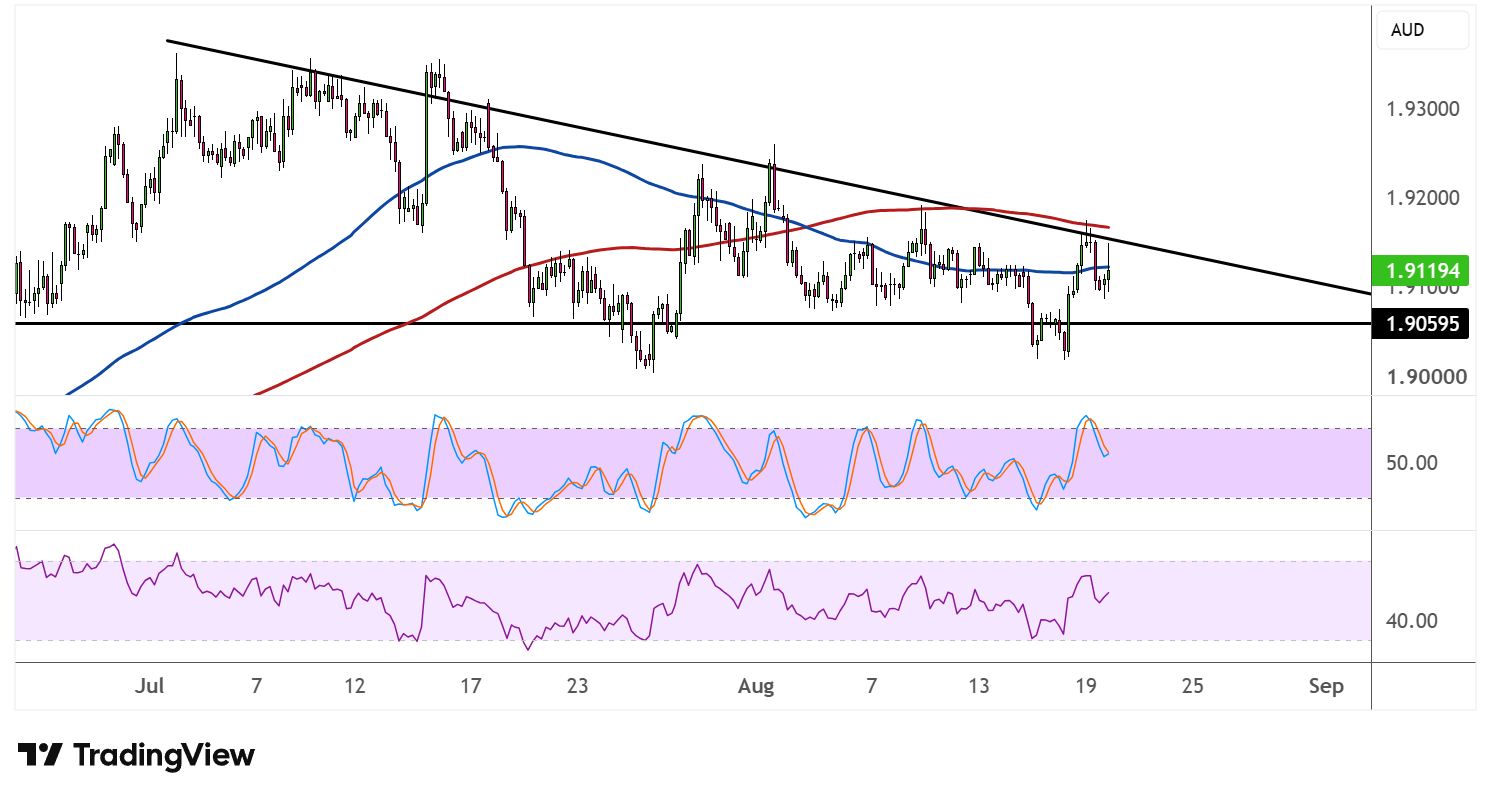
Looking at the moving averages, both the 100 SMA and 200 SMA have flattened out and are converging near current price, reflecting the indecision that’s been building within the triangle. Neither indicator currently holds a clear edge, which mirrors the balanced tug-of-war between buyers and sellers.
Stochastic recently climbed up from the oversold region and is now near the overbought zone, hinting that a bit of bullish pressure could be building. If the oscillator turns lower from here, though, it may just reflect the range-bound conditions instead of a genuine reversal.
RSI has also ticked higher recently but remains below the overbought threshold, leaving some room to climb further if buyers manage to seize control. Traders may want to watch for a decisive breakout from the triangle, paired with stronger oscillator readings, before committing to a directional bias.



Comments
Log in or sign up to join the conversation.