

Bearish view
- Sell the GBP/USD pair and set a take-profit at 1.3300.
- Add a stop-loss at 1.3550.
- Timeline: 1-2 days.
Bullish view
- Buy the GBP/USD pair and set a take-profit at 1.3550.
- Add a stop-loss at 1.3300.
(Click on image to enlarge)
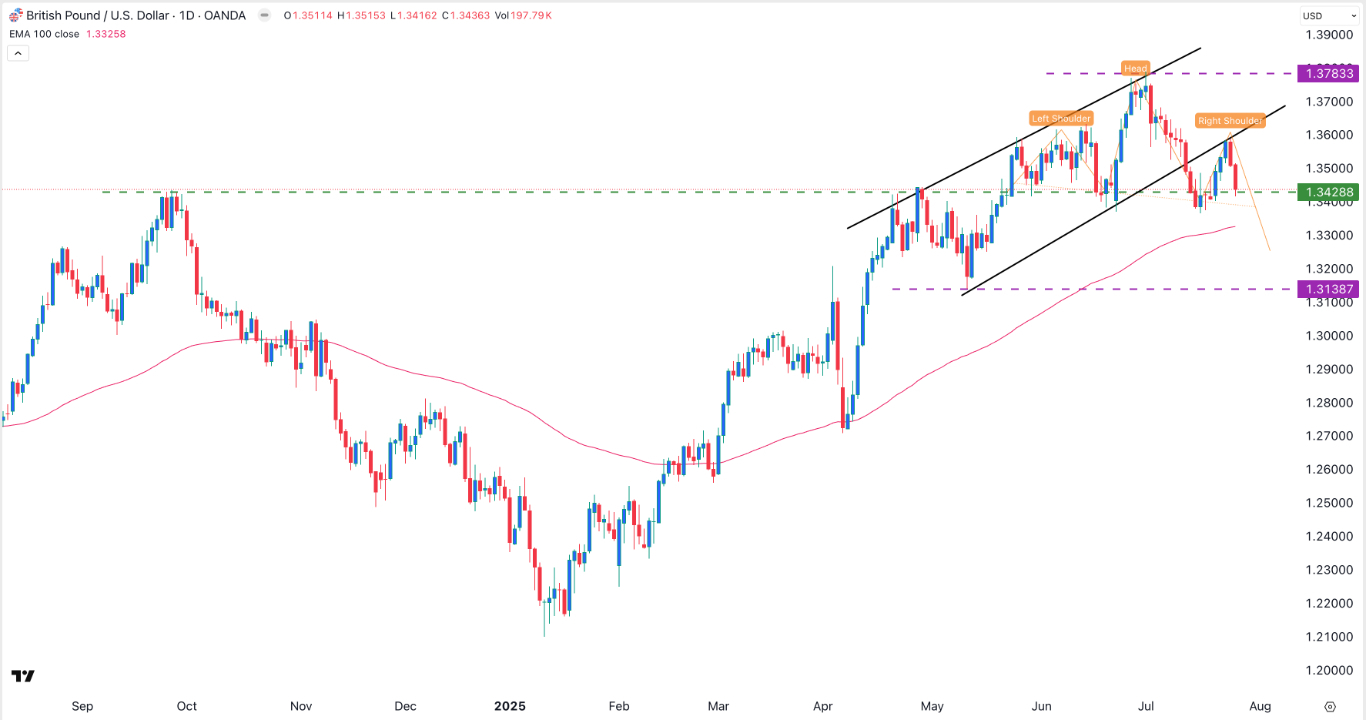
The GBP/USD exchange rate remained under pressure after the UK published weaker-than-expected retail sales on Friday and as investors waited for the coming Fed decision and key economic data. It retreated to a low of 1.3435, down by over 2.56% from its highest point this year.
Fed and key US economic data ahead
The GBP/USD pair retreated after the UK published the latest retail sales data. According to the Office of National Statistics (ONS), the country’s retail sales rose by 0.9% in June, a partial rebound from the 2.8% plunge in May. The increase was mostly because of the country’s warmer weather during the month.
While this increase was encouraging, it was lower than the median estimate of 1.2%. Many consumers are struggling because of the elevated inflation, which rose to 3.6% in June. As a result, the country’s consumer confidence retreated in July as consumers wait for a rax increase.
Consumer confidence has also dropped becuse of the slowing labor market and high interest rates. Economists expect the bank to cut interest rates by 0.25% in the upcoming meeting in August.
The GBP/USD pair will react to the upcoming consumer confidence report from the United States. Economy expect the report to show a slight increase in confidence after the strong jobs numbers in June.
The Federal Reserve will deliver its interest rate decision on Wednesday, with most analysts expecting it to leave them unchanged between 4.25% and 4.50%.
Further, the US will publish the latest GDP data on Wednesday, personal consumption expenditure (PCE) on Thursday, and nonfarm payrolls report on Friday. Thes numbers will provide more hints on when the Fed will start cutting interest rates.
GBP/USD technical analysis
The daily chart shows that the GBP/USD exchange rate has pulled back in the past few weeks. It moved from the year-to-date high of 1.3783 to the current 1.3435.
The pair conducted a break-and-retest pattern by rising to the important resistance point at 1.3592. This was a notable level because it was along the lower side of the ascending channel.
The pair moved to the key support at 1.3428, the highest swing in September last year. It has also formed a head-and-shoulders pattern, a popular bearish reversal sign.
Therefore, the pair will likely continue falling as sellers target the key support at 1.3300.
More By This Author:
Top Catalysts For The Nikkei 225 Index This WeekBTC/USD Forex Signal Bullish Pennant Points To More Gains
Top 4 Reasons The Nio Stock Price Is Soaring And What Next



Comments
Log in or sign up to join the conversation.