

The Department of Energy's Energy Information Administration (EIA) monthly data on volume sales is several weeks old when it is released. The latest numbers, through mid-November, are now available. Gasoline prices and increases in fuel efficiency are important factors, but there are also some significant demographic and cultural dynamics in this data series.
Because the sales data are highly volatile with some obvious seasonality, we've added a 12-month moving average (MA) to give a clearer indication of the long-term trends. The latest 12-month MA is 8.1% below its all-time high set in August 2005.
(Click on image to enlarge)

The next chart includes an overlay of real monthly retail gasoline prices, all grades, and formulations, adjusted for inflation using the Consumer Price Index (the red line). We've shortened the timeline to start with EIA price series, which dates from August 1990. The retail prices are updated weekly, so the price series is the more current of the two.
(Click on image to enlarge)
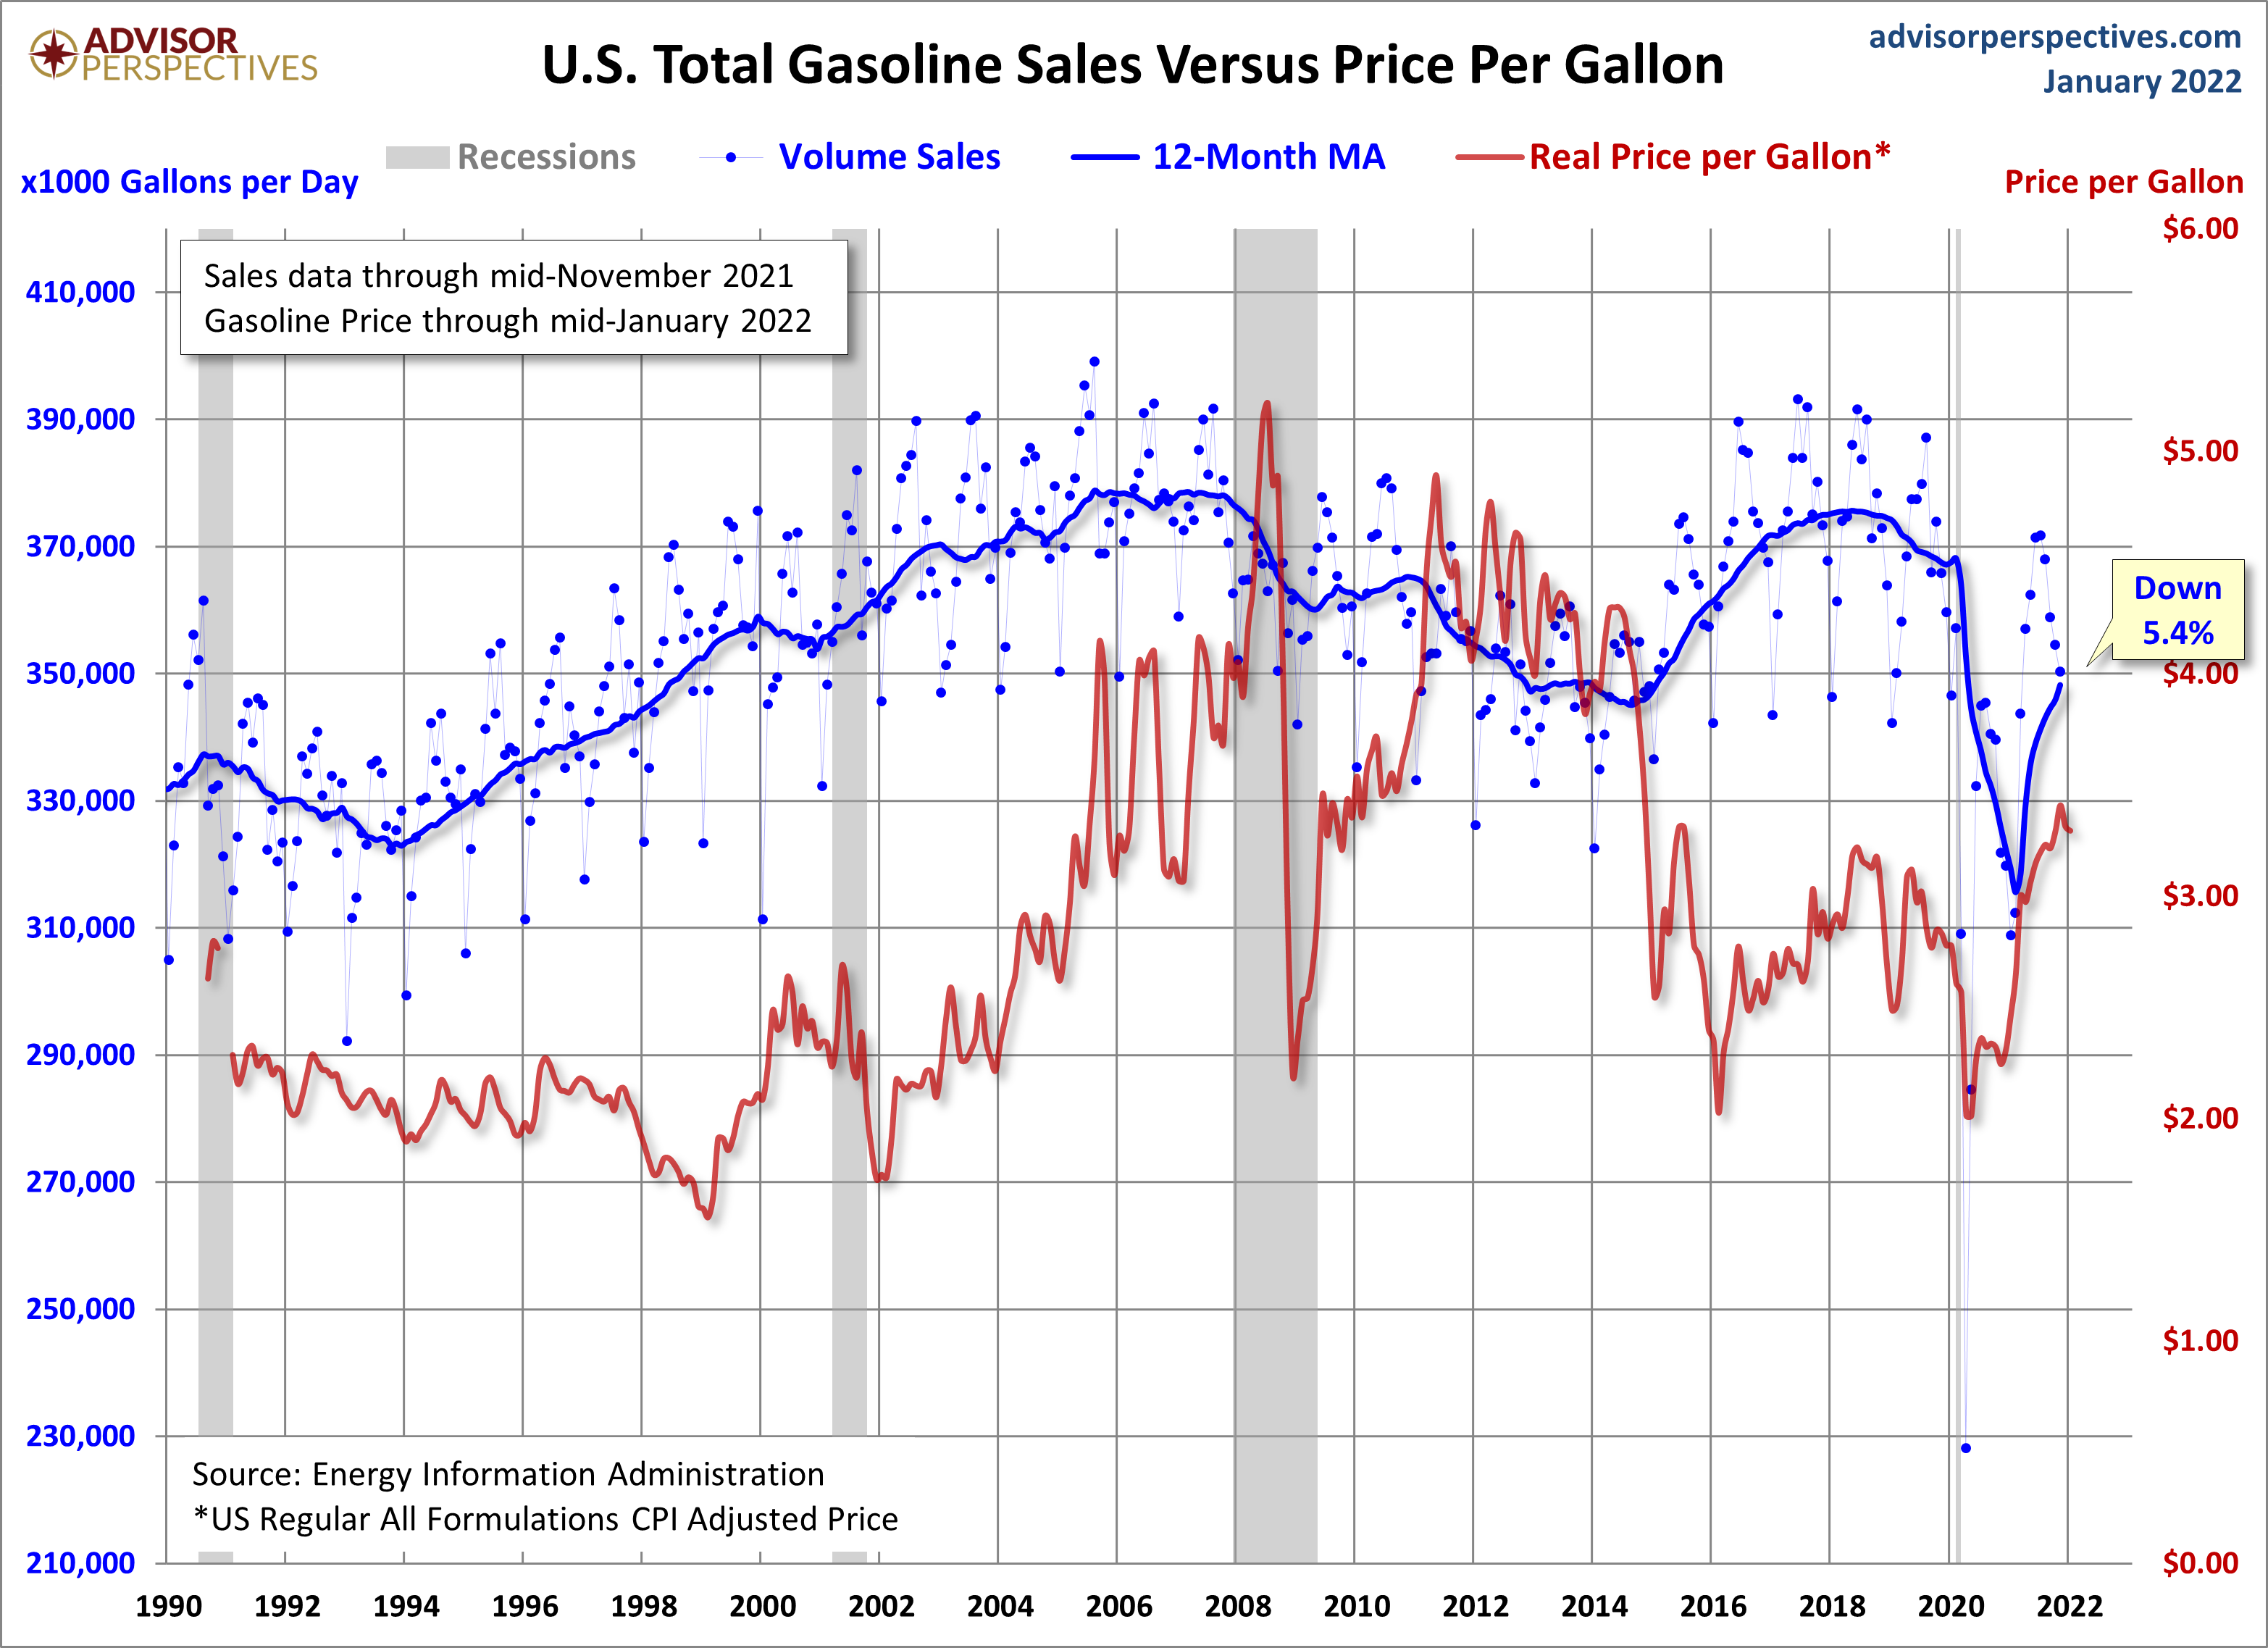
As we would expect, the rapid rise in gasoline prices in 2008 was accompanied by a significant drop in sales volume. With the official end of the recession in June 2009, sales reversed direction. As a result of COVID-19 and the resulting recession, both gas prices and sales have dropped rapidly. The moving average for the latest month is 5.4% below the pre-COVID recession level. Clearly, gasoline prices were falling beginning in 2018 and the global pandemic facilitated a further and rapid drop.
Average Daily Volume Sales Per Capita
The next chart adjusts the 12-month MA of sales volume for population growth based on the monthly data for Civilian Non-Institutional Population over age 16 from the Bureau of Labor Statistics, via the St. Louis FRED repository. What we see here is that gasoline sales on a per-capita basis are 6.1% lower than at the beginning of the current recession The gallons-per-capita series includes the complete EIA data, but since we're using the 12-month MA, the blue line starts in 1984. We see the double peak in March 1989 (the all-time high) and August 1990. The latest per-capita daily average is 25.7% below the 1989 high.
(Click on image to enlarge)
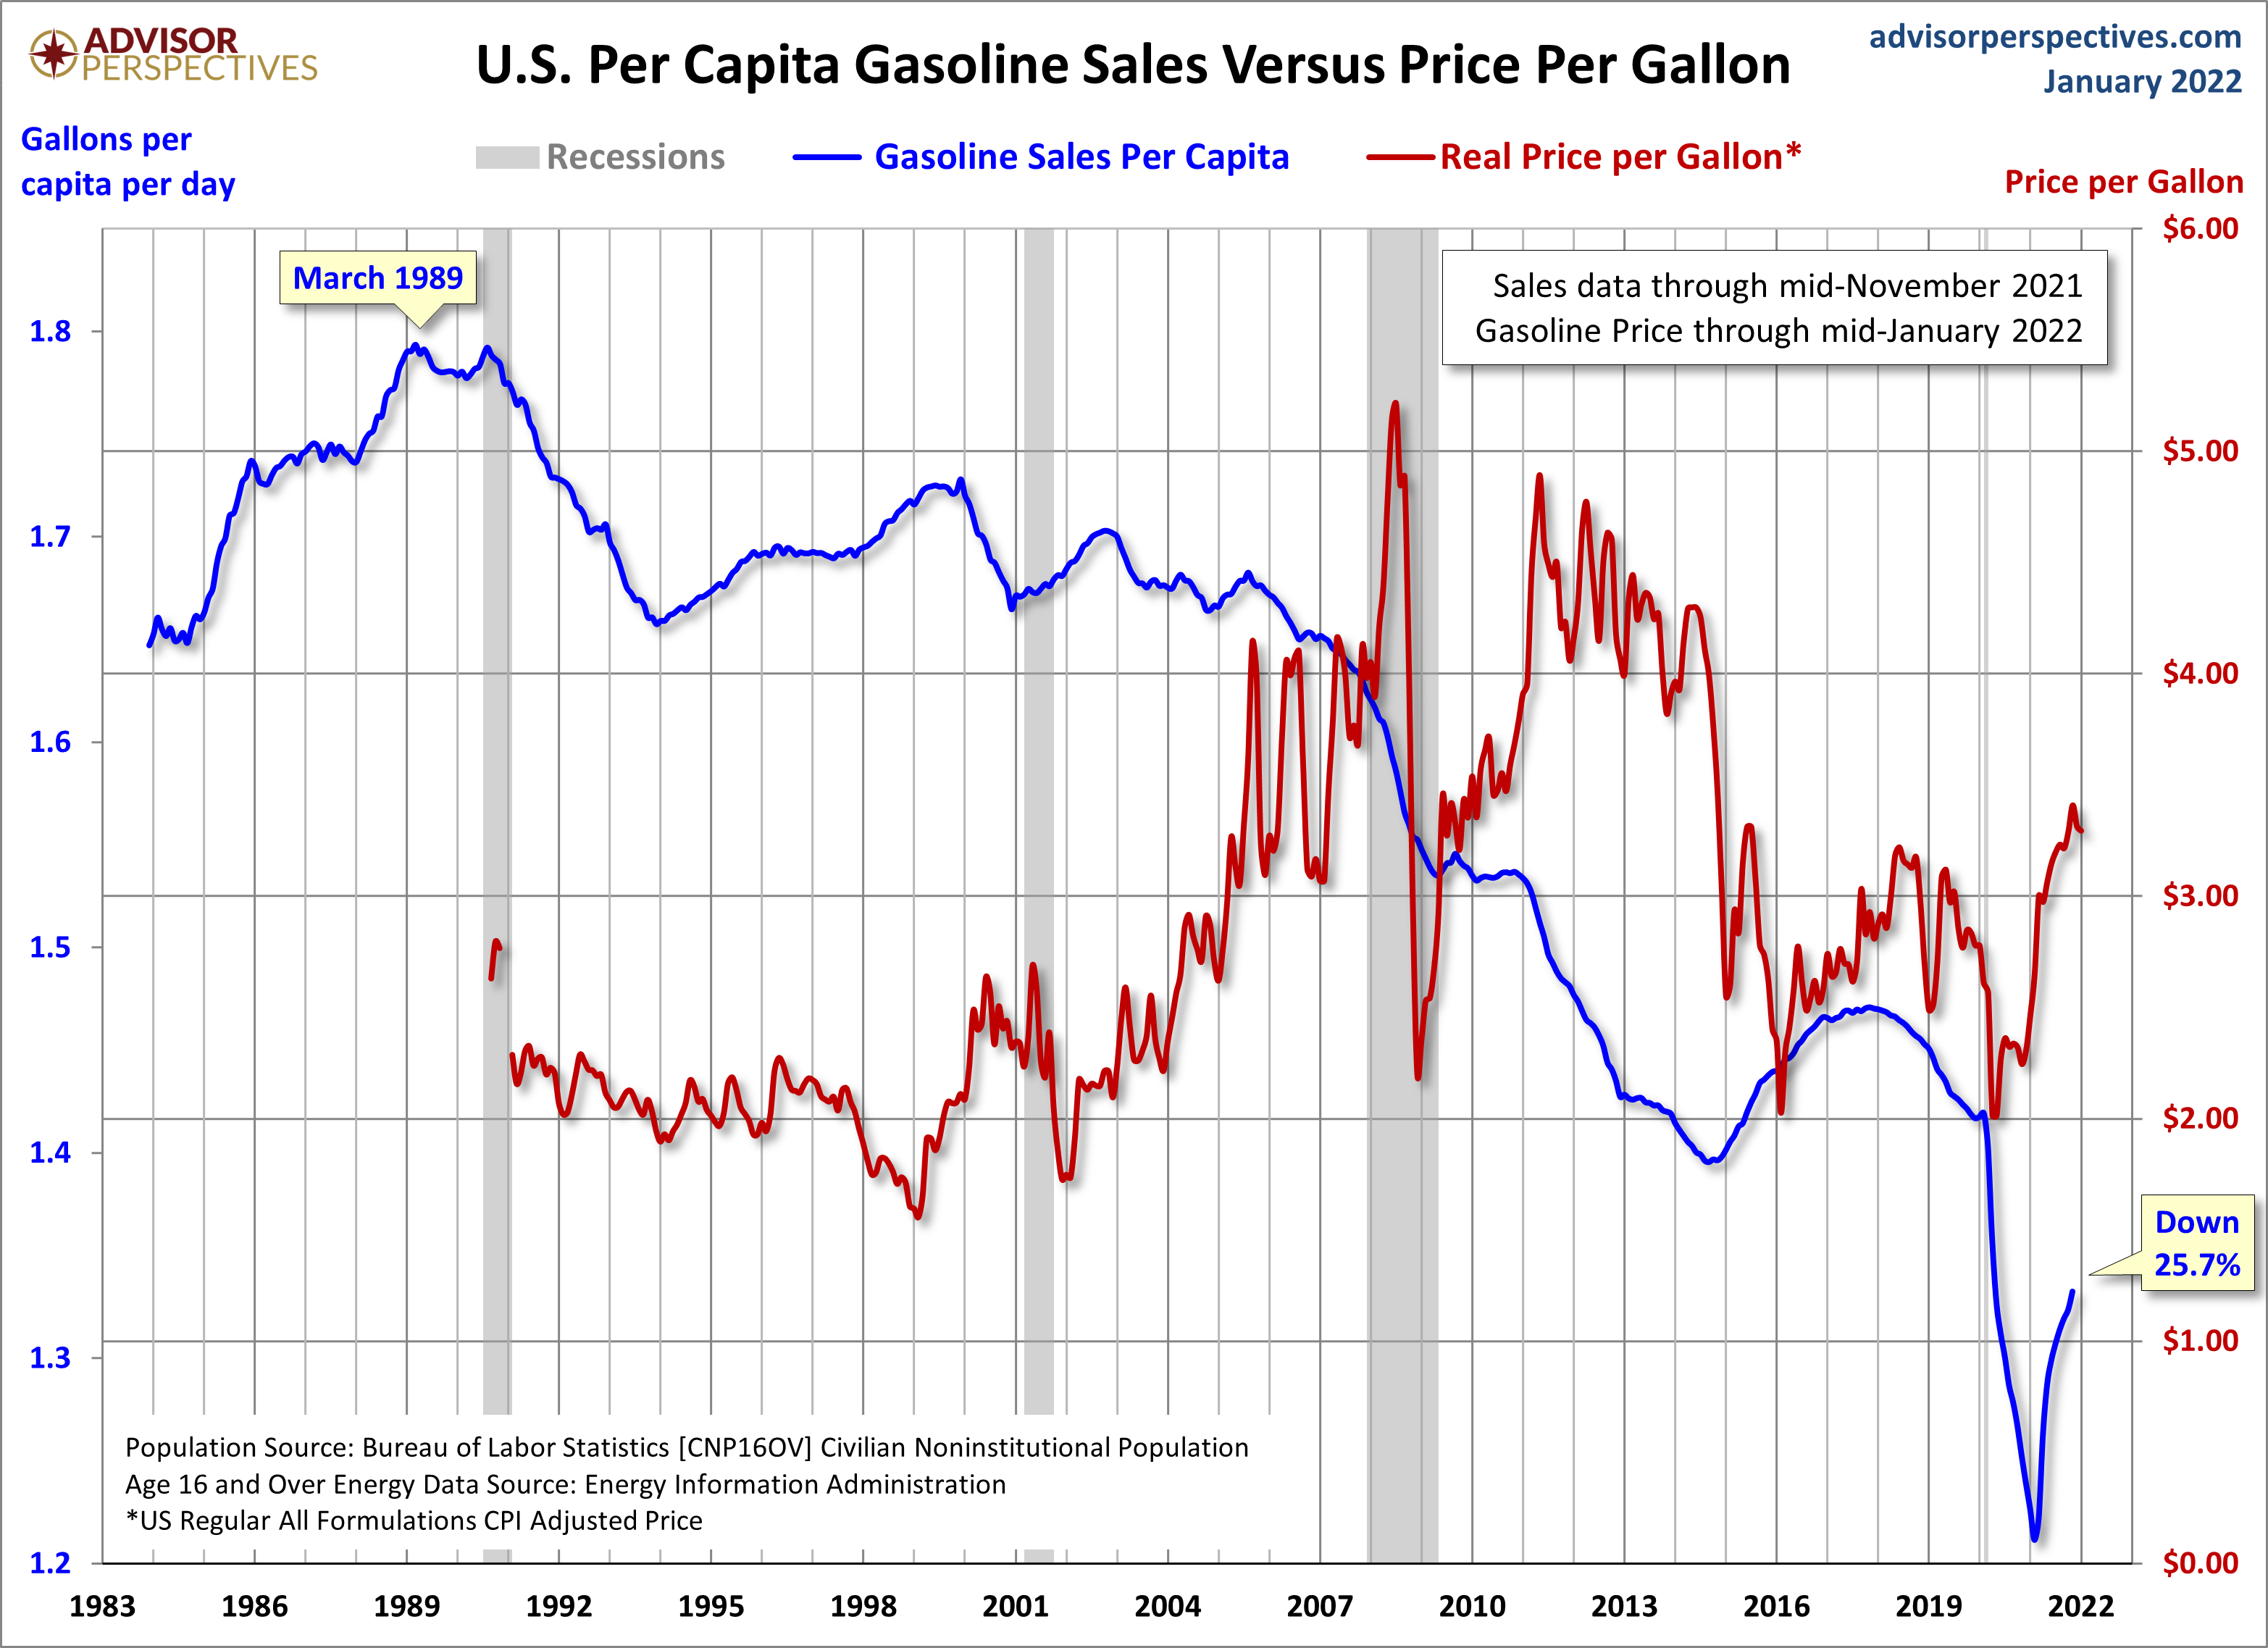
What does this analysis suggest about the state of the economy? The economic recovery after the Great Recession did not seem to improve the plight of gasoline sales. The COVID-19 pandemic have resulted in plummeting sales per capita have despite general gasoline sales bouncing back.



Comments
Log in or sign up to join the conversation.