

Turning to the markets, tensions with North Korea and better-than expected economic data out of China are in focus this morning. The Dow, S&P 500 and Nasdaq indices are coming off three straight losing sessions and start the day at two month lows. And with the Dow and S&P having put in a “lower low” on the charts, it appears that a downtrend is developing. Thus, the price action in the near-term takes on added importance this week.
Now let’s move on to an objective review the key market models and indicators. To review, the primary goal of this exercise is to remove any preconceived, subjective notions about the markets and ensure that I stay in line what “is” really happening in the market. So, let’s get started.
The State of the Trend
We start each week with a look at the “state of the trend.” These indicators are designed to give us a feel for the overall health of the current short- and intermediate-term trend models.
Executive Summary
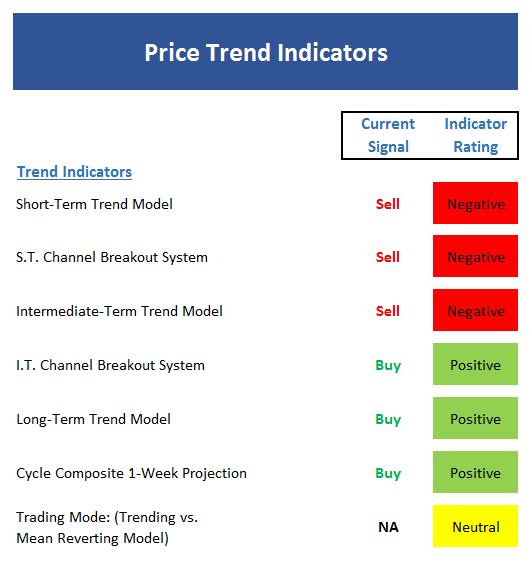
- The short-term Trend Model has turned negative as price is below the moving average, which itself is moving lower. This is the definition of a downtrend.
- The short-term Channel Breakout System has flashed a sell signal. But with the market now in a mean reverting mode, this signal could be reversed with a modest rebound.
- The intermediate-term Trend Model has also flipped to negative. A close above 2360 would reverse the sell signal.
- The intermediate-term Channel Breakout System remains positive. However a close below 2320(ish) would turn this indicator red as well.
- The long-term Trend Model remains solidly positive.
- The Cycle Composite has turned positive and suggests higher prices for the next three weeks.
- The Trading Mode models now suggest stocks are in a mean reverting mode. We will be on the lookout for these models to flip to the “trending lower” mode.
The State of Internal Momentum
Next up are the momentum indicators, which are designed to tell us whether there is any “oomph” behind the current trend…
Executive Summary
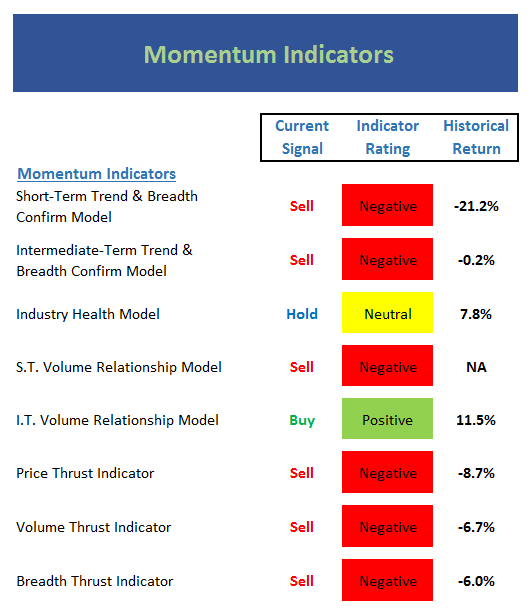
- Our short-term Trend and Breadth Confirm Model moved to negative last week. However this can also be viewed as a sign of an oversold condition. Thus, the near-term action will be important.
- Our intermediate-term Trend and Breadth Confirm Model remains negative this week.
- There was little change to the Industry Health Model and it remains neutral this week.
- The short-term Volume Relationship continues to weaken. Our Up Volume indicator currently stands at the lows level since July 2015.
- The intermediate-term Volume Relationship model is remains positive, but the trend of demand volume is now down.
- The Price Thrust Indicator has slipped into the negative zone, albeit only by the slimmest of margins.
- The Volume Thrust Indicator also turned red last week.
- The Breadth Thrust Indicator also is negative, confirming that the current environment is now weak.
The State of the “Trade”
We also focus each week on the “early warning” board, which is designed to indicate when traders may start to “go the other way” — for a trade.
Executive Summary
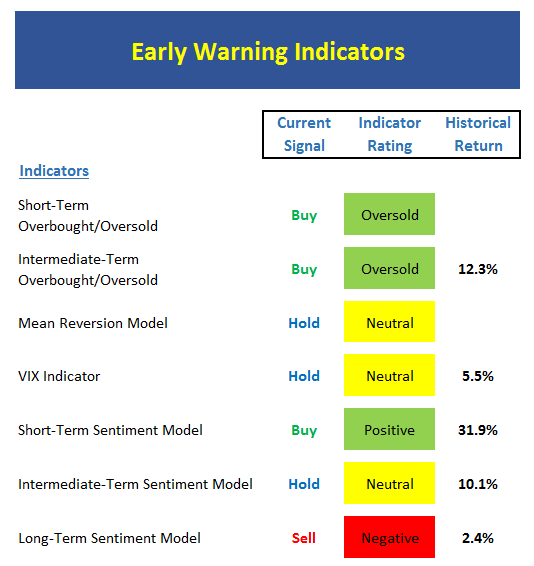
- From a near-term perspective, stocks are now oversold – but not dramatically so.
- From an intermediate-term view, stocks are oversold according to our model, but neutral according to a weekly stochastic measure.
- The Mean Reversion Model has moved to neutral.
- The VIX Indicator is close to giving a buy signal as the VIX has spiked to levels not seen since before the election.
- From a short-term perspective, market sentiment is starting to move into the positive zone.
- The intermediate-term Sentiment Model remains in never-land.
- Longer-term Sentiment readings remain negative, but are improving.
The State of the Macro Picture
Now let’s move on to the market’s “external factors” – the indicators designed to tell us the state of the big-picture market drivers including monetary conditions, the economy, inflation, and valuations.
Executive Summary
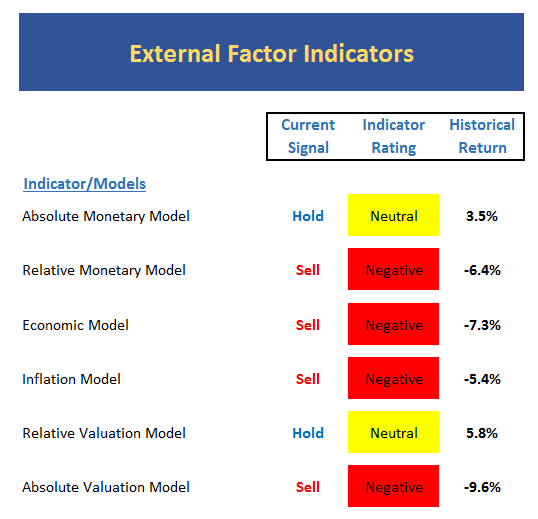
- Absolute Monetary conditions continue to trend lower, are at the lowest levels since 2013, and could soon turn negative.
- On a relative basis, our Monetary Model slipped back into the negative zone. As such, it can be said that monetary conditions are now a headwind for the stock market.
- Our Economic Model (designed to call the stock market), which has been “lost” to say the least for the past 9 months is now improving.
- The Inflation Model remains negative, but only by a hair.
- Our Relative Valuation Model continues to fall within the neutral zone.
- The Absolute Valuation Model is still negative.
The State of the Big-Picture Market Models
Finally, let’s review our favorite big-picture market models, which are designed to tell us which team is in control of the prevailing major trend.
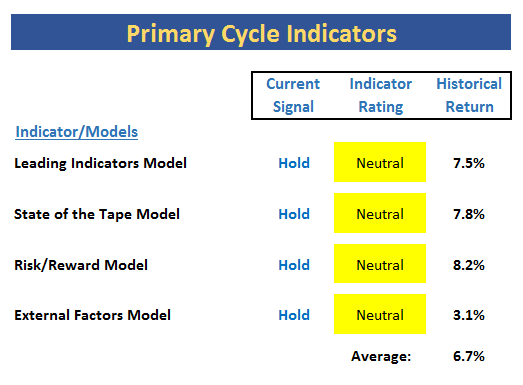
Executive Summary
- The Leading Indicators model has moved back up into the neutral zone, but remains on a sell signal.
- The Tape Model remains neutral at this time
- The Risk/Reward model remains stuck at the low end of neutral
- The External Factors model has improved in the last few weeks and is now very close to neutral
The Takeaway
With the S&P 500 having put in a “lower low” last week, it is clear that stocks are in a downtrend from a short-term perspective. Yet, at the same time, the market has reached an oversold condition. As such, it’s “game on” in terms of the next intermediate-term trend. A meaningful close below 2320 would embolden the bears and likely create a test of the 2250 zone while a “stop” by the bulls (right here, right now) would suggest that a test of the highs could be the next order of business. In short, the question of the day is if a meaningful decline has begun, or if we are simply seeing some “price discovery” to the downside here to set up the next leg higher. Stay tuned.
Current Market Drivers
We strive to identify the driving forces behind the market action on a daily basis. The thinking is that if we can both identify and understand why stocks are doing what they are doing on a short-term basis; we are not likely to be surprised/blind-sided by a big move. Listed below are what we believe to be the driving forces of the current market (Listed in order of importance).
1. The state of geopolitical issues
2. The State of the U.S. Economy
3. The State of Trump Administration Policies
4. The State of Global Central Bank Policies



Comments
Log in or sign up to join the conversation.