

Below are some of the more interesting commodity and futures charts with a comment about each.
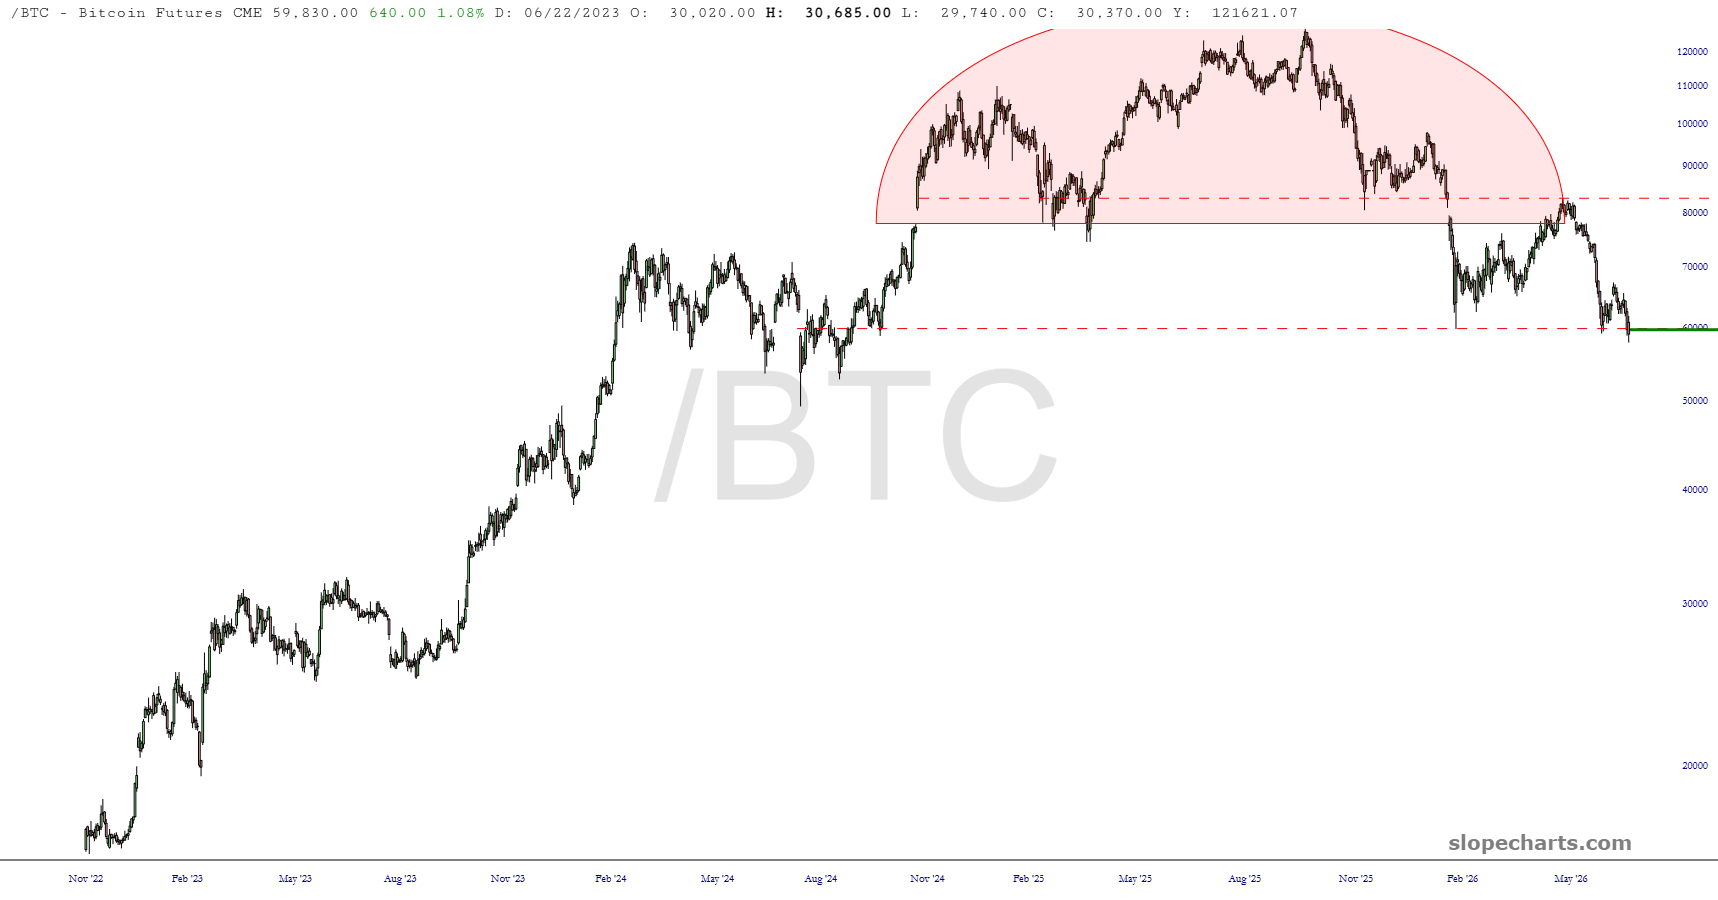
First up is Bitcoin, which is sporting what must be one of the biggest head and shoulders tops of all time. the next head is either going to see this thing continue to fall to pieces or drive folks like me batty by rallying above support.
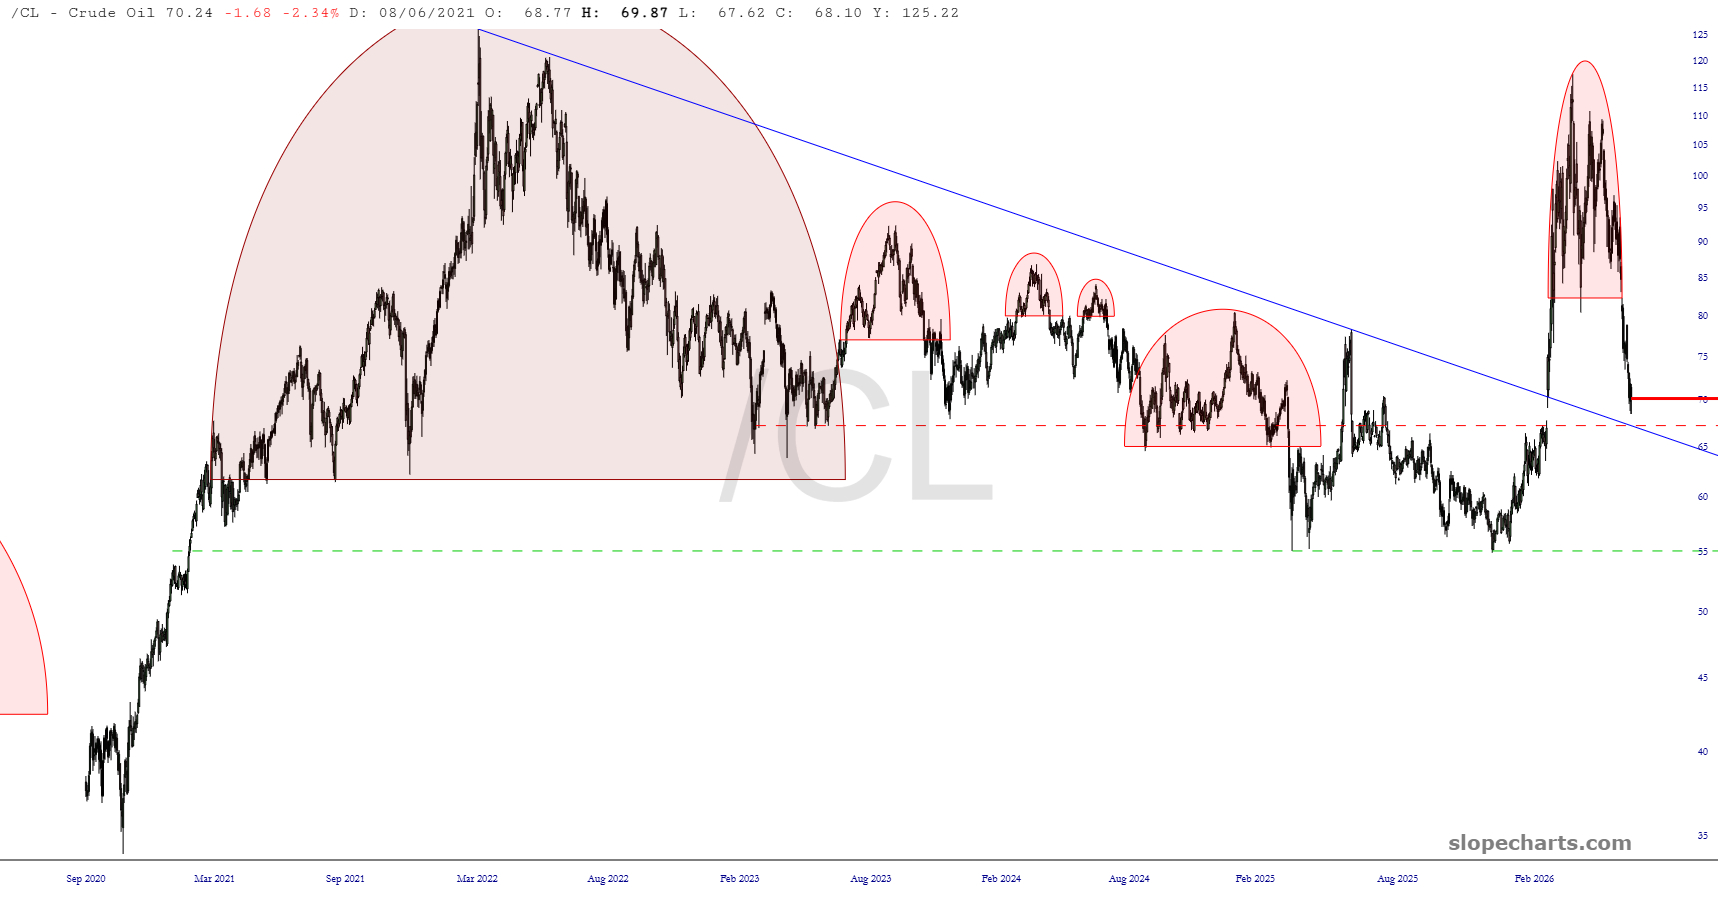
Crude oil has had obvious reasons for movement over the past three months. The war-based burst higher has been totally unwound. The most likely next move is a rally back toward that topping pattern before taking a more aggressive move to cut below major support.
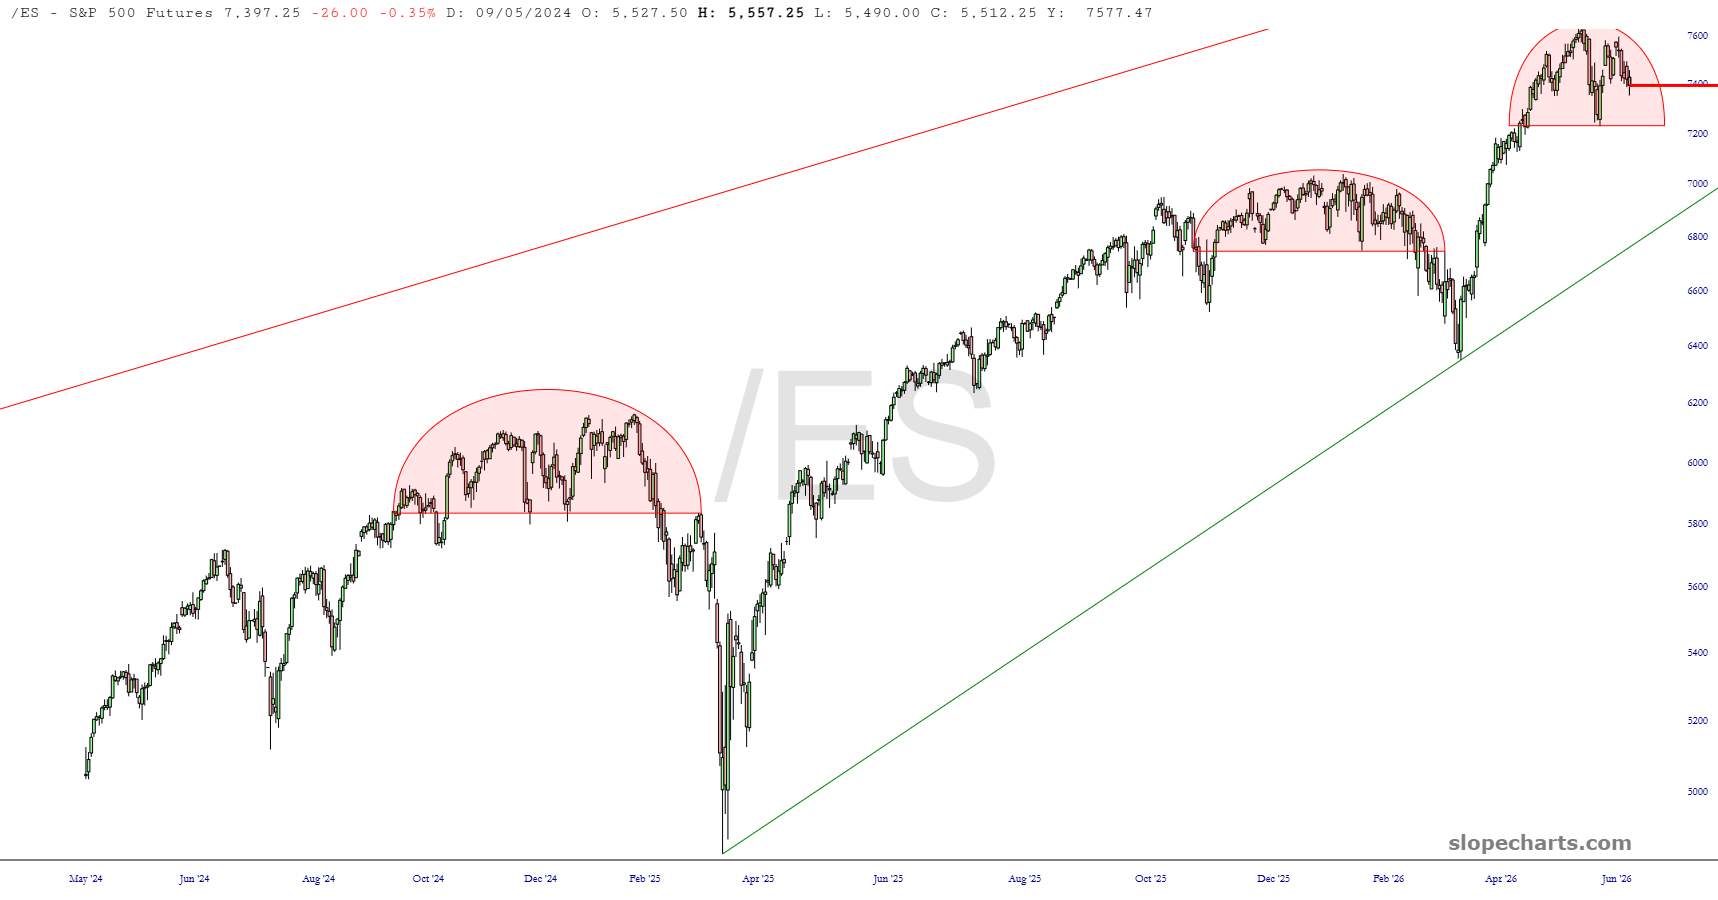
The S&P 500 is in the throes of a new topping pattern which is about 70% complete.
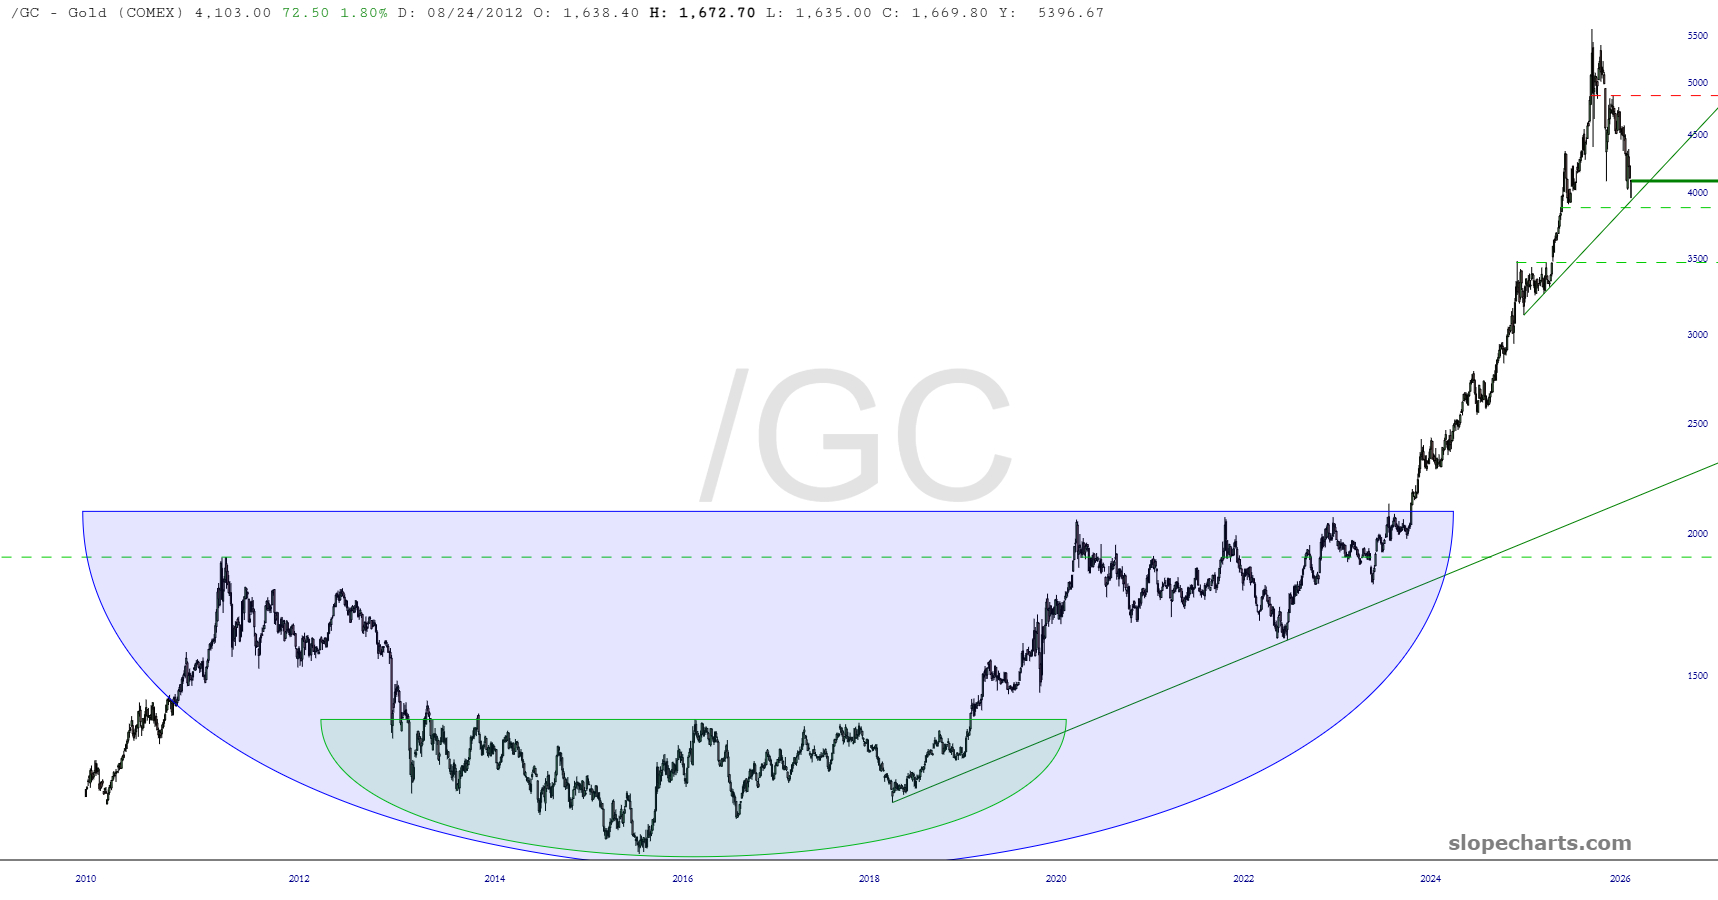
Gold has lost about $1600 from its peak in January. This one is a bit of a tough call. I had predicted a fall to $4,000, and it made it already. That’s where the trendline is. A failure of this line, however, could easily send gold down to $3500.
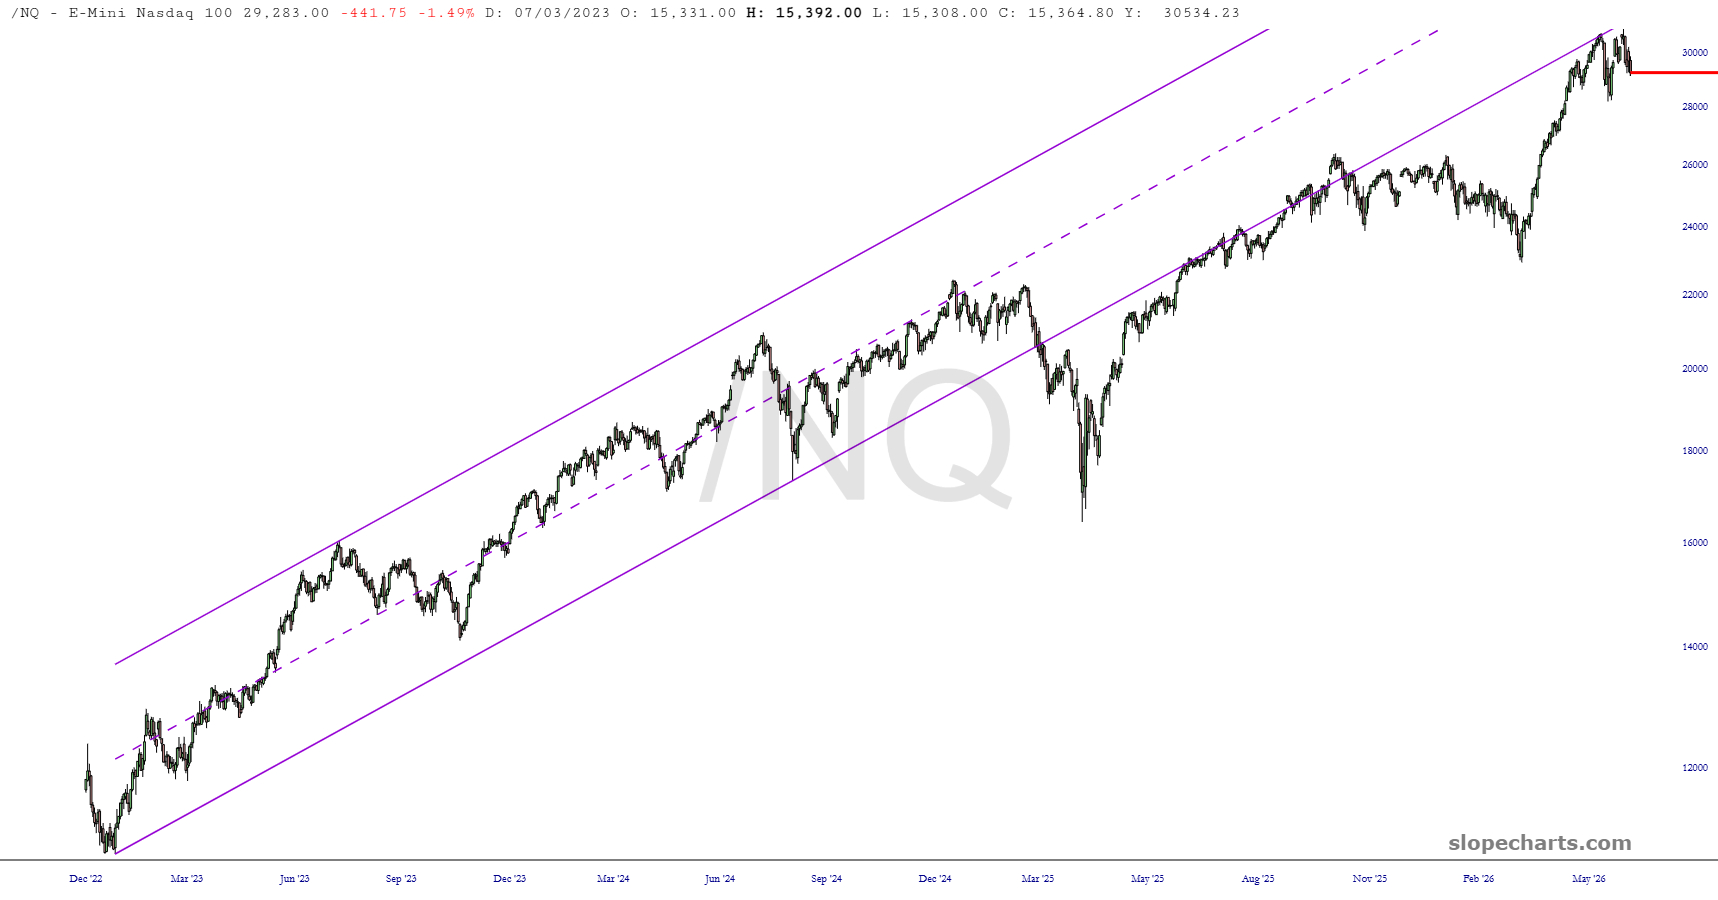
The NASDAQ has been in a bull market for 18 years. It used to be bounded by a channel, but years ago it broke beneath this channel and has been skirting just beneath it ever since.
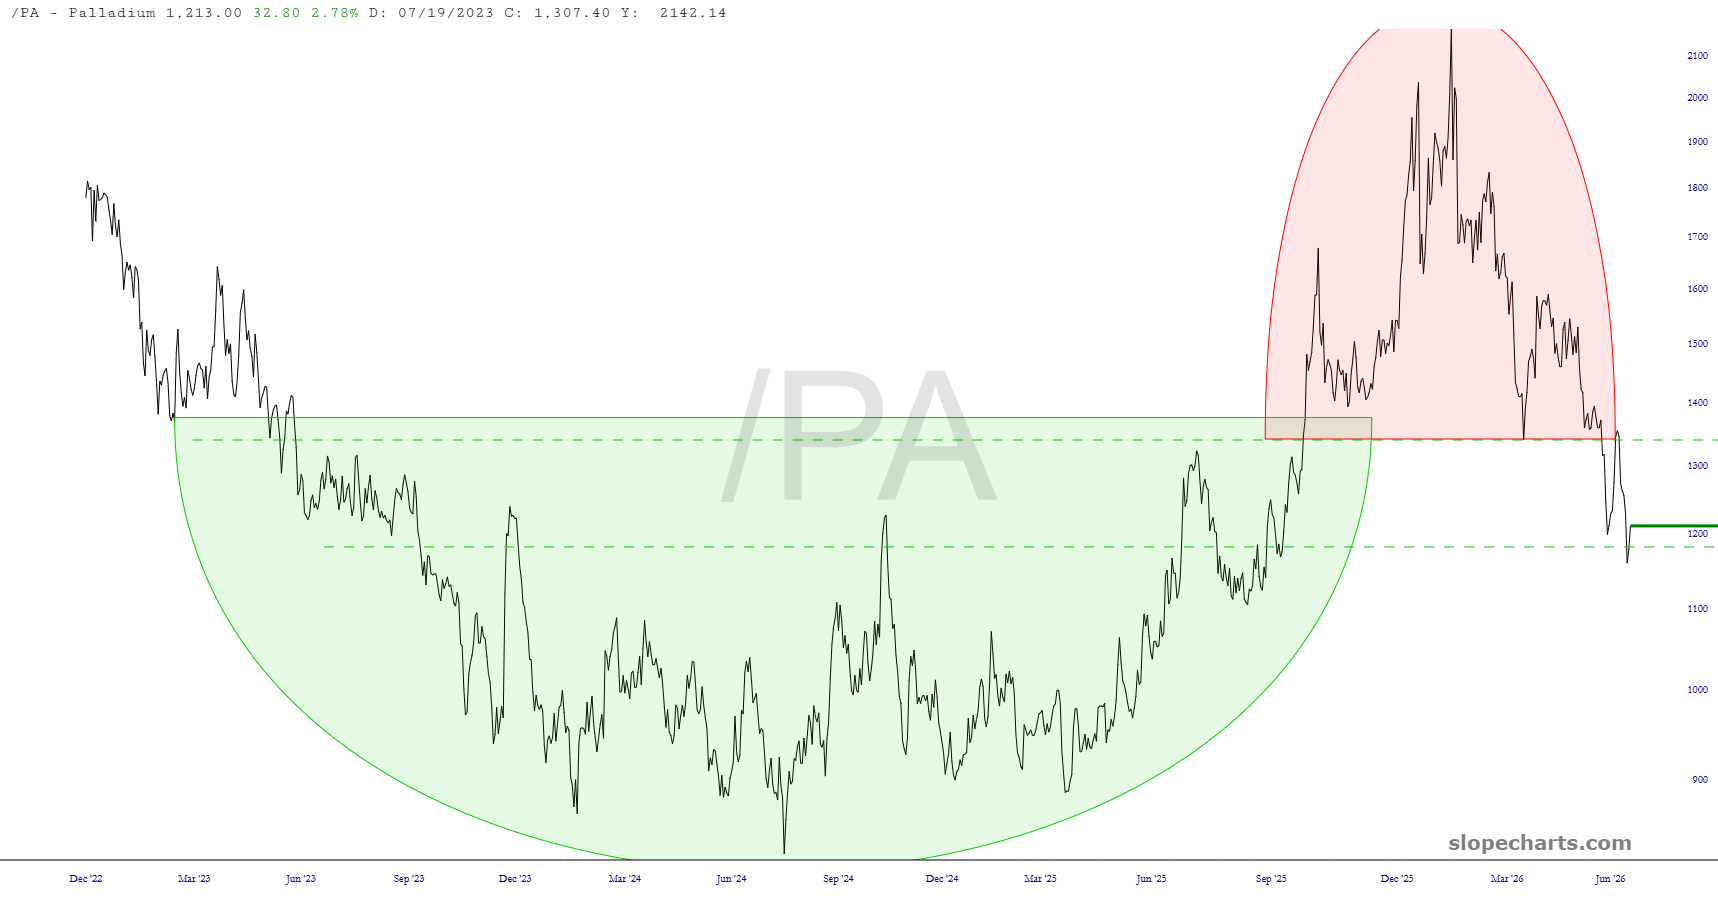
Palladium’s magnificent rally in late 2025 and early 2026 has been totally obliterated. There is a face-off between the large bullish pattern in green and the oppositional bearish pattern in pink. It may rally from here, but my view is that the topping pattern constitutes very serious resistance.

Comments
Log in or sign up to join the conversation.