

Written by Dana Lyons
The big, round 20K number for the Dow Jones Industrial Average means very little to us from an investment decision standpoint. There is another, lesser-known index that is approaching a level of major significance (in our view) and it's the Value Line Geometric Composite.
The Value Line Geometric Composite (VLG) is an in weighted average that tracks the median stock performance among a universe of approximately 1800 stocks. Thus, in our view, it serves as perhaps the best representation of the true state of the U.S. equity market. Additionally, it has historically been very true to technical analysis and charting techniques, which is quite remarkable considering there are no tradeable vehicles based on it - and, as noted, the VLG is testing a monumental level at the moment, going back several decades.

- In 1998, the VLG topped out just north of 500 before getting cut in half over the next 4 years.
- In 2007, the index once again climbed back over the 500 level. It subsequently [rose[ again over the next two years – this time by 70%.
- In 2014, after a five-year rally, the VLG finally made it back to the 500 level again... For a third time, the index was rejected at that level dropping hard into the fall of 2014.
- Finally, in the spring of 2015, the VLG was able to surpass the peaks just above 500, rallying as high as 523 In April 2015. The rally proved short-lived, however, as the index proceeded to lose nearly 30% over the next 10 months.
Candidly, it was our view that that false breakout marked the final blow to the post-2009 cyclical bull market. As such, we expected any subsequent bounce to be a mere bear market rally, falling far short of the previous 3-decade peaks. Up until the election, that notion still appeared on track, as the post-February rally in the VLG fell some 6% shy of its previous highs, even as the large-cap indices went to new highs.
The “Trump Rally” has forced us to re-think that view, however,...because the VLG has shot up some 14% since election day and has now arrived in the vicinity of its former highs once again.
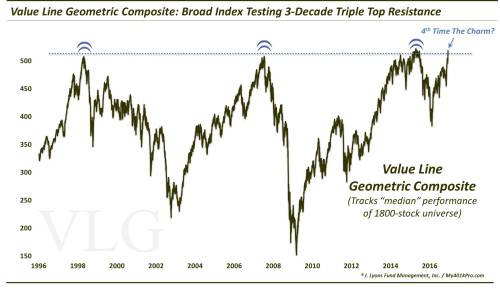
The VLG may well struggle initially at these levels, as it always has, and, as always, we advise against “anticipating the breakout”. However, this may be the VLG’s best chance yet to break this massive 3-decade resistance. The fact that it avoided a catastrophic selloff (e.g., 1998-2002, 2007-2009) this time before managing to return to its peaks suggests a higher level of demand (cup-&-handle?).
Should the VLG succeed in breaking decisively above its former peaks, its significance probably cannot be overstated. This would be an extremely broad market gauge breaking out above 18-year, triple top peaks to new all-time highs. The short-term, and quite possibly long-term, ramifications could be exceedingly bullish.
The above is why the 520-ish level in the Value Line Geometric Composite is the key level for investors to watch, in our view – even if no one has made up hats to commemorate it.


.webp)
Comments
Log in or sign up to join the conversation.