

The foreign exchange (forex) market is the largest and most liquid financial market in the world, with a daily trading volume exceeding $6 trillion. Forex trading has become increasingly popular among individual traders and investors, attracted by the potential for substantial profits and the ability to trade 24 hours a day, five days a week. In this highly volatile and fast-paced market, forex analysis has emerged as a powerful tool for traders to identify potential market movements and make informed trading decisions.
Technical analysis is a method of evaluating securities by analyzing statistics generated by market activity, such as past prices and volume. By studying historical price patterns and market data, technical analysts aim to identify trends and potential turning points in the market, enabling them to make more accurate predictions about future price movements.
What is Technical Analysis?
Technical analysis is a trading discipline that relies on the study of price charts and market data to identify patterns and trends. Unlike fundamental analysis, which focuses on economic factors and company financials, technical analysis is based on the premise that all relevant information is already reflected in the price movements of a security.
The underlying principles of technical analysis are rooted in the belief that market movements are not entirely random and that prices move in trends. Technical analysts believe that history tends to repeat itself, and by studying past price patterns, they can identify potential future market behavior.
One of the key advantages of technical analysis is that it provides traders with a visual representation of market data, allowing them to identify patterns and trends more easily. By analyzing price charts, traders can gain insights into market sentiment, supply and demand dynamics, and potential support and resistance levels.
Key Technical Analysis Tools
Technical analysts employ a variety of tools and indicators to analyze market data and identify potential trading opportunities. Here are some of the most commonly used technical analysis tools:
Chart Patterns
Chart patterns are visual representations of price movements that can indicate potential reversals or continuations in market trends. Some of the most widely recognized chart patterns include:
- Head and Shoulders: A reversal pattern that signals a potential trend change from bullish to bearish (or vice versa).
- Double Top/Bottom: A reversal pattern that forms after an asset has experienced two consecutive peaks (tops) or troughs (bottoms).
- Triangles: Continuation patterns that can signal a potential breakout in the direction of the prevailing trend.
Recognizing and interpreting these patterns can help traders identify potential entry and exit points for their trades.
Trend Lines and Channels
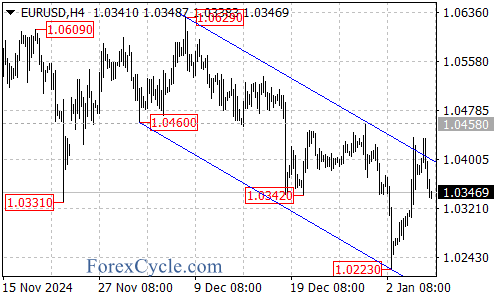
Trend lines and channels are technical analysis tools used to identify the direction and strength of a trend. Trend lines are drawn by connecting two or more price points, while channels are formed by drawing parallel lines above and below the price action.
Traders use trend lines and channels to identify support and resistance levels, which can provide valuable insights into potential entry and exit points. When prices break through a trend line or channel, it may signal a potential trend reversal or continuation.
Moving Averages
Moving averages are widely used technical indicators that smooth out price data by calculating the average price over a specified period. There are different types of moving averages, including simple moving averages (SMAs) and exponential moving averages (EMAs).
Traders often use moving averages to identify the overall trend direction and potential entry and exit points. For example, when the price crosses above a moving average, it may signal a potential buy signal, while a cross below the moving average could indicate a potential sell signal.
Oscillators
Oscillators are technical indicators that fluctuate between predefined ranges and are used to identify overbought and oversold conditions in the market. Some popular oscillators include the Relative Strength Index (RSI) and the Stochastic Oscillator.
Traders use oscillators in conjunction with other technical indicators to identify potential entry and exit points. For example, when the RSI reaches an extreme value (above 70 or below 30), it may signal that the market is overbought or oversold, respectively, and a potential reversal could be imminent.
Developing a Trading Strategy
While technical analysis tools can provide valuable insights into market behavior, it’s essential to develop a well-defined trading strategy that incorporates multiple indicators and risk management techniques. A comprehensive trading strategy should include:
-
Combining Multiple Technical Indicators: Using a combination of chart patterns, trend lines, moving averages, and oscillators can increase the accuracy of your analysis and reduce the risk of false signals.
-
Risk Management Techniques: Implementing risk management techniques, such as stop-loss orders and position sizing, can help protect your capital and minimize potential losses.
-
Backtesting and Forward-Testing: Backtesting your trading strategy on historical data and forward-testing it on a demo account can help you refine and optimize your approach before trading with real money.
-
Continuous Adaptation: Markets are constantly evolving, and it’s essential to continuously refine and adapt your trading strategy based on changing market conditions and new insights.
Limitations and Risks of Technical Analysis
While technical analysis can be a powerful tool for traders, it’s important to recognize its limitations and potential risks. Technical analysis is not a foolproof system, and there is always the possibility of false signals or unexpected market events that can invalidate your analysis.
Additionally, overreliance on technical indicators without considering fundamental factors or market sentiment can lead to suboptimal trading decisions. It’s crucial to combine technical analysis with fundamental analysis and risk management strategies to increase the chances of success in forex trading.
Conclusion
Technical analysis provides forex traders with a valuable set of tools to identify potential market movements and make informed trading decisions. By studying price charts, recognizing patterns, and utilizing technical indicators, traders can gain insights into market sentiment, trends, and potential entry and exit points.
However, it’s important to remember that technical analysis is not a guaranteed path to success. Traders should develop a well-defined trading strategy that incorporates multiple technical indicators, risk management techniques, and continuous adaptation to changing market conditions.
Ultimately, successful forex trading requires a combination of technical analysis, fundamental analysis, risk management, and discipline. By mastering these skills and continuously refining your approach, you can increase your chances of achieving consistent profits in the dynamic and challenging world of forex trading.


Comments
Log in or sign up to join the conversation.