
The Australian Dollar lost half a cent in trading today on the back of poor economic data showing a third consecutive monthly fall in new home approvals. Economists had expected a monthly rise of 2% but last month saw approvals for the construction of new homes slump for the third month in a row, down 5.6 per cent. Consumer confidence has been flat to negative since the Budget was announced three weeks ago and this is likely to have ongoing negative effects on the state of the Australian economy in the short to medium term.
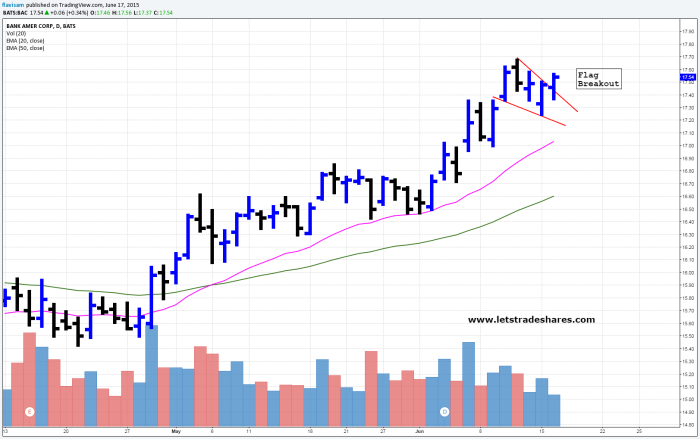
The technical picture for the Australian Dollar Vs the US Dollar is shown in the chart below.
The up-trend from February to April has now moved sideways and formed a support level at $0.9200 with a series of lower highs. Friday saw the formation of a doji candle with today’s negative economic data pushing prices lower back towards the support level. The price chart shows the formation of a descending triangle which may signal that further price declines could occur.
The support level of $0.9200 needs to hold to prevent any further declines. If the price is able to breach this support and close below $0.9200 then the price of the Australian Dollar is likely to keep falling in line with the known technical properties of a descending triangle.
I will keep this on my watchlist and look at entering a short trade if the price breaches support.
Happy Trading
Flavio

AUD/USD DAILY CHART

Comments
Log in or sign up to join the conversation.