
EUR/USD
4 hour
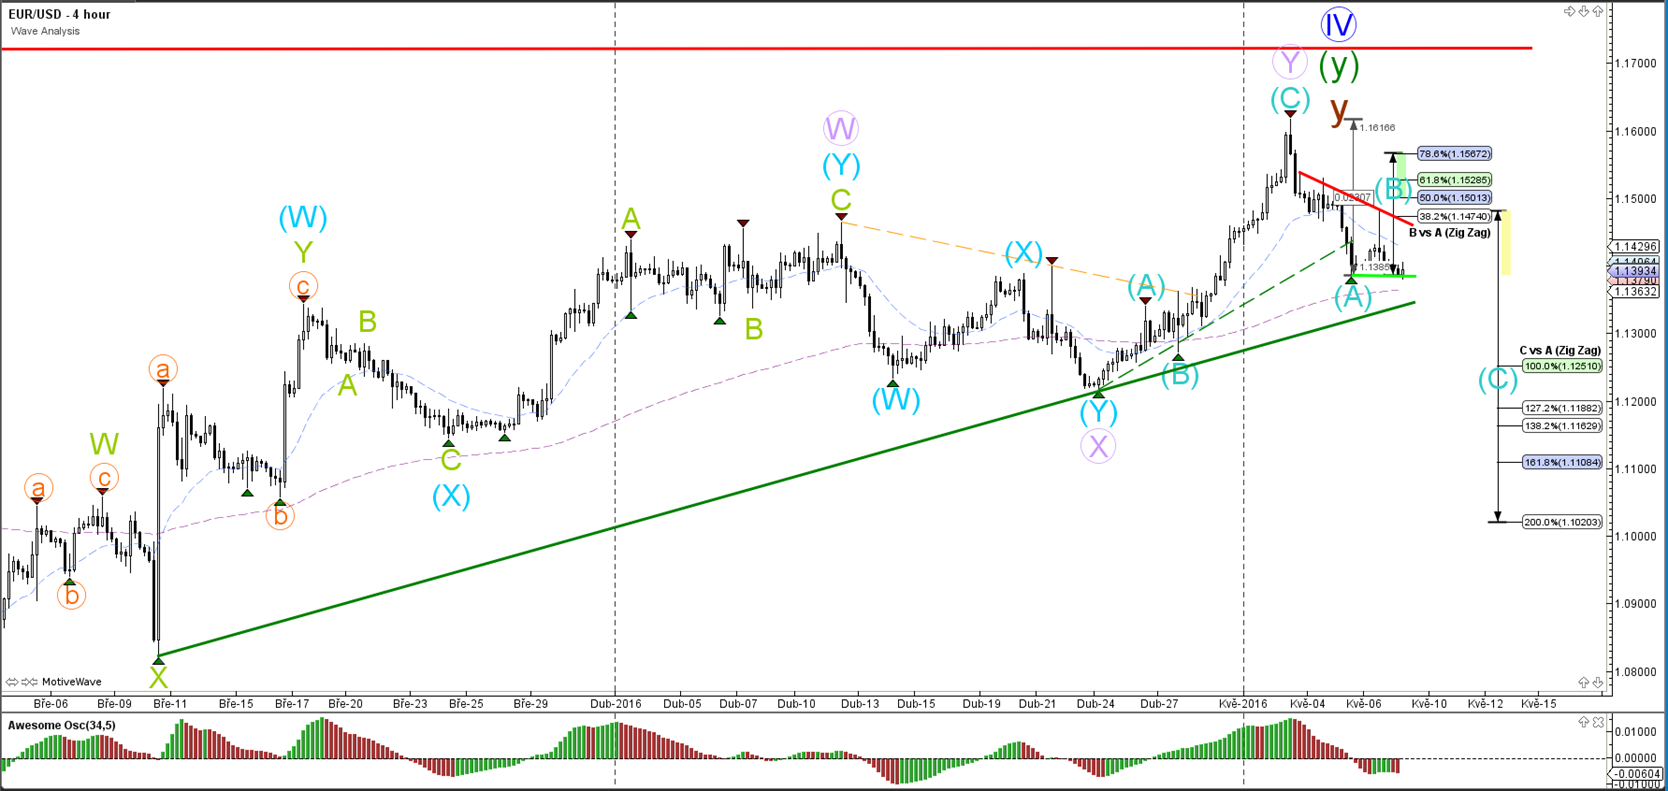
The EUR/USD remains above the support trend line (solid green), which could mark the difference between a retracement (for more upside) or a reversal (for more downside). For the moment a bearish ABC (blue) pattern seems the most likely path of least resistance.
1 hour

The EUR/USD is building a descending wedge chart pattern (orange/green). The EUR/USD break above resistance (orange) could indicate the end of the ABC (blue), although the Fibonacci levels of B vs A could still play a role. A break below support (green) could indicate the continuation of an ABC zigzag towards Fibonacci targets C vs A.
GBP/USD
4 hour

The GBP/USD's has respected the 38.2% Fibonacci retracement level of wave B vs A. A break of the support trend line would confirm the downtrend on the GBP/USD whereas a bounce at support could indicate the completion of the ABC (pink) and an expansion of the uptrend.
1 hour

The GBP/USD completed an ABC (blue) within wave B (pink). A bullish break above the resistance trend line (red) could indicate a completion of wave C (pink). A bearish break below the support trend lines (green) could price expand wave A (pink) lower.
USD/JPY
4 hour

The USD/JPY is building an ascending wedge triangle chart pattern (red/blue). A bullish break of the triangle could indicate a trend change (from down trend to uptrend) whereas a bearish break of the triangle could see a downtrend continuation unfold.
1 hour
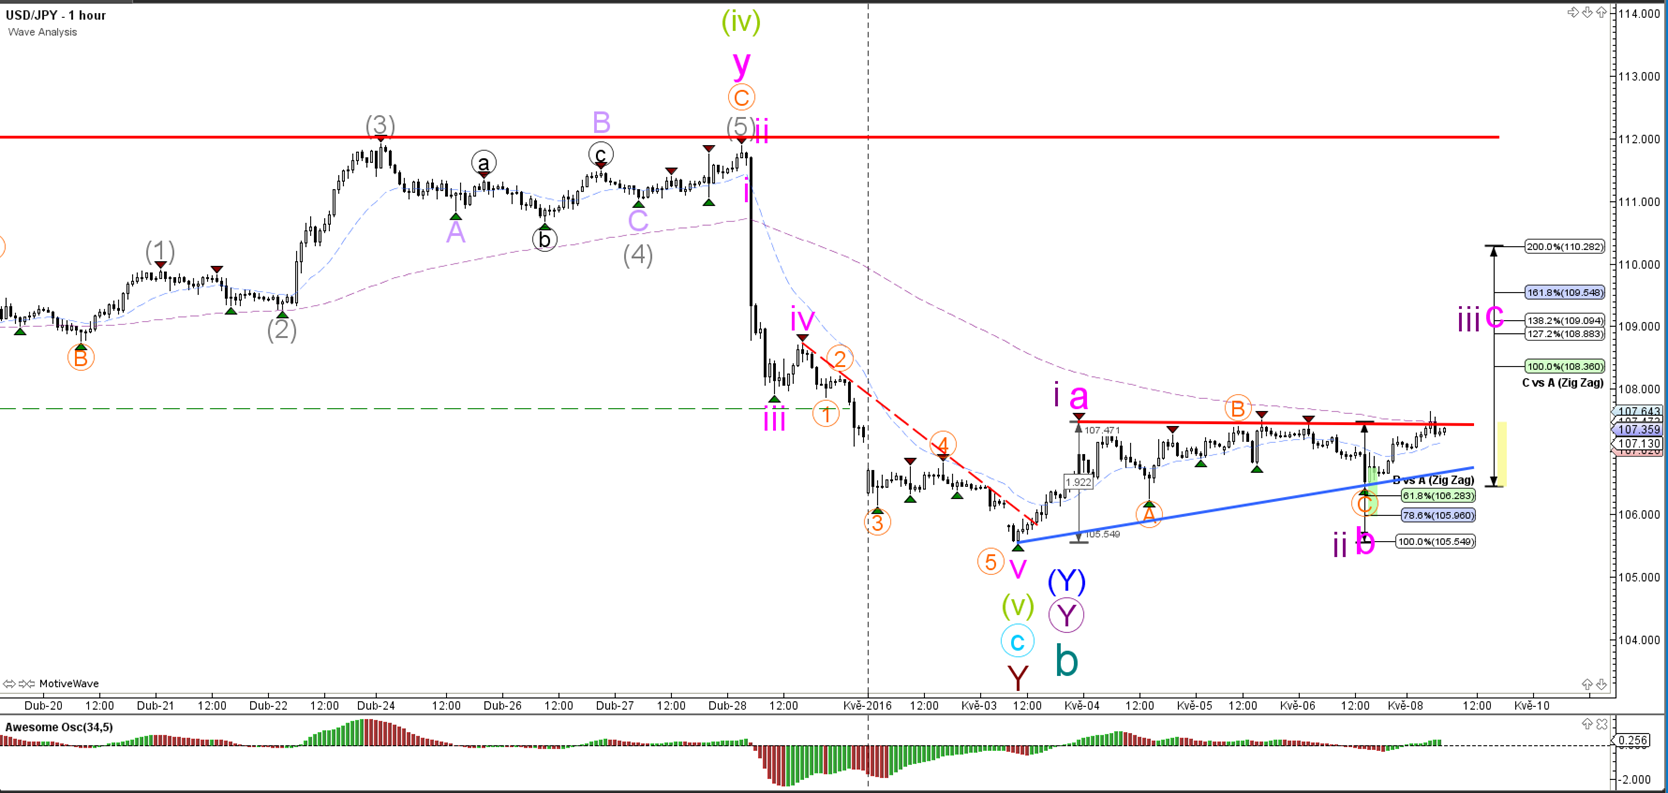
The USD/JPY attempted to break above the resistance trend line (red) but has failed several times. A successful attempt could see the continuation of wave C. The other likely wave count is the start of an impulsive wave count via 123 (purple).


Comments
Log in or sign up to join the conversation.