
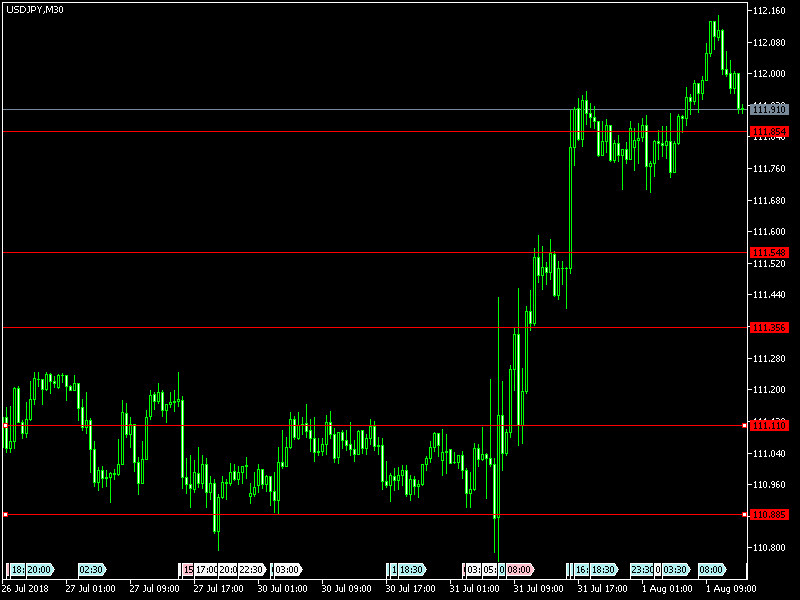
First, we look into the previous day trade and what happened on July 31, 2018, and it opened at 111.046 and went high at 111.929 and gone low 110.727 and finally closed at 111.844. The calculated pivot point for the day is 111.500
The difference between high and low was nearly 1.202 points and there was a very good chance for a trader to take the opportunity between low to high levels and finally benefited.
The pair is going to high levels from support levels, it may be a breakout trend for today and trader should be cautious since it reached overbought region and buy at support levels for more profits. Four hour chart followers may consider buy at 111.955, 112.551 and sell at 111.615, 110.750 levels.
LEVELS TO BE WATCHED FOR TRADERS FOR THEIR TRADING
|
Level |
First Level |
Second Level |
Third Level |
|
Selling Level |
111.10 |
110.70 |
110.25 |
|
Buying Level |
112.20 |
112.65 |
113.10 |
EVENTS TO BE OBSERVED AT THESE TIMES TO TAKE MORE ADVANTAGE
USDJPY FUNDAMENTALS TODAY
|
GMT |
Event |
Actual |
Previous |
|---|---|---|---|
|
00:30 |
JPY Nikkei Manufacturing PMI |
52.3 |
51.6 |
|
05:00 |
JPY Vehicle Sales (YoY) |
1.2% |
-7.3% |
|
11:00 |
USD MBA Mortgage Applications |
-0.2% |
|
|
12:15 |
USD ADP Employment Change |
177K |
|
|
13:45 |
USD Markit Manufacturing PMI |
55.5 |
|
|
14:00 |
USD ISM Prices Paid |
76.8 |
|
|
14:00 |
USD ISM Manufacturing PMI |
60.2 |
|
|
14:00 |
USD Construction Spending (MoM) |
0.4% |
See the levels in the Chart and trade accordingly
Comments
Log in or sign up to join the conversation.