
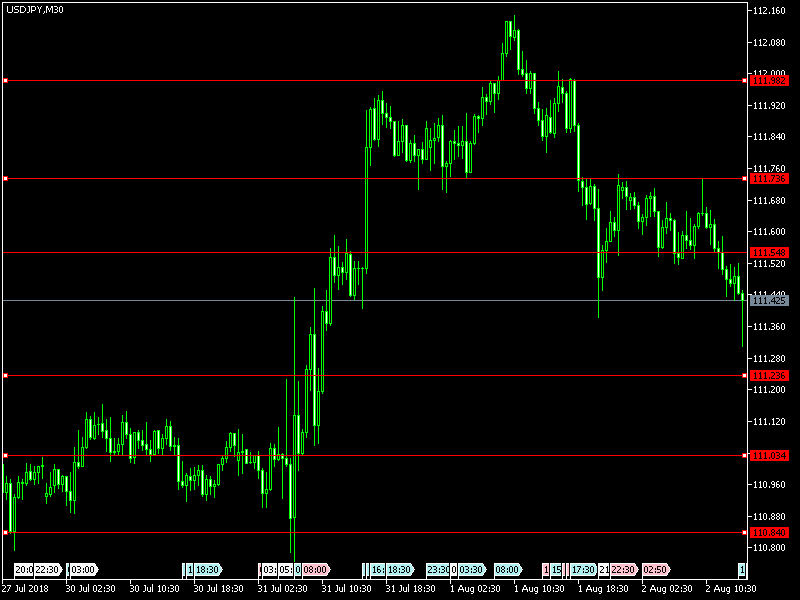
First, we look into the previous day trade and what happened on August 1, 2018, and it opened at 111.862 and went high at 112.127 and gone low 111.419 and finally closed at 111.600. The calculated pivot point for the day is 111.715
The difference between high and low was nearly 0.708 points and there was a very good chance for trader to take the opportunity between low to high levels and finally benefited.
The pair is going to high levels from support levels, it may be sideways trend for today and trader should cautious since it is coming from over bought region and buy at support levels for more profits. Four hour chart followers may consider to buy at 111.955, 112.688 and sell at 111.476, 110.828 levels.
LEVELS TO BE WATCHED FOR TRADERS FOR THEIR TRADING
|
Level |
First Level |
Second Level |
Third Level |
|
Selling Level |
111.08 |
110.70 |
110.27 |
|
Buying Level |
112.22 |
112.65 |
113.08 |
EVENTS TO BE OBSERVED AT THESE TIMES TO TAKE MORE ADVANTAGE
USDJPY FUNDAMENTALS TODAY
|
GMT
|
Event |
Previous |
|---|---|---|
|
11:30 |
USD Challenger Job Cuts (YoY) |
37.202K |
|
12:30 |
USD Initial Jobless Claims |
217K |
|
12:30 |
USD Continuing Jobless Claims |
1.745M |
|
13:45 |
USD ISM NY index - Business Conditions |
55 |
|
14:00 |
USD Factory Orders (MoM) |
0.4% |
|
14:30 |
USD EIA Natural Gas Storage change |
24B |
See the levels in the Chart and trade accordingly
Comments
Log in or sign up to join the conversation.