

First, we look into the previous day trade and what happened on July 27, 2018, and it opened at 111.224 and went high at 111.239 and gone low 110.794 and finally closed at 110.999. The calculated pivot point for the day is 111.010,
The difference between high and low was nearly 0.445 points and there was a good chance for trader to take the opportunity between low to high levels and finally benefited.
Now the opportunity is, the pair is going to lower levels for few days due to dollar become weak. If EURUSD goes high USDJPY goes down and vice versa and watch two pairs for trading before entering into a trade. For many days, the range for this pair was moving between 109.360 to 114.740 levels. Hourly traders especially three-hour chart followers are waiting for an opportunity to buy at 111.211, 111.615 levels or sell at 110.625, 110.343 levels to get maximum profit.
LEVELS TO BE WATCHED FOR TRADERS FOR THEIR TRADING
|
Level |
First Level |
Second Level |
Third Level |
|
Selling Level |
110.58 |
110.25 |
119.92 |
|
Buying Level |
111.77 |
112.20 |
112.63 |
EVENTS TO BE OBSERVED AT THESE TIMES TO TAKE MORE ADVANTAGE
USDJPY FUNDAMENTALS TODAY
|
GMT |
Event |
Previous |
|---|---|---|
|
14:00 |
USD Pending Home Sales (MoM) |
-0.5% |
|
14:00 |
USD Pending Home Sales (YoY) |
-2.2% |
|
14:30 |
USD Dallas Fed Manufacturing Business Index |
36.5 |
|
n/a |
USD Loan Officer Survey |
|
|
15:30 |
USD 3-Month Bill Auction |
1.97% |
|
15:30 |
USD 6-Month Bill Auction |
2.14% |
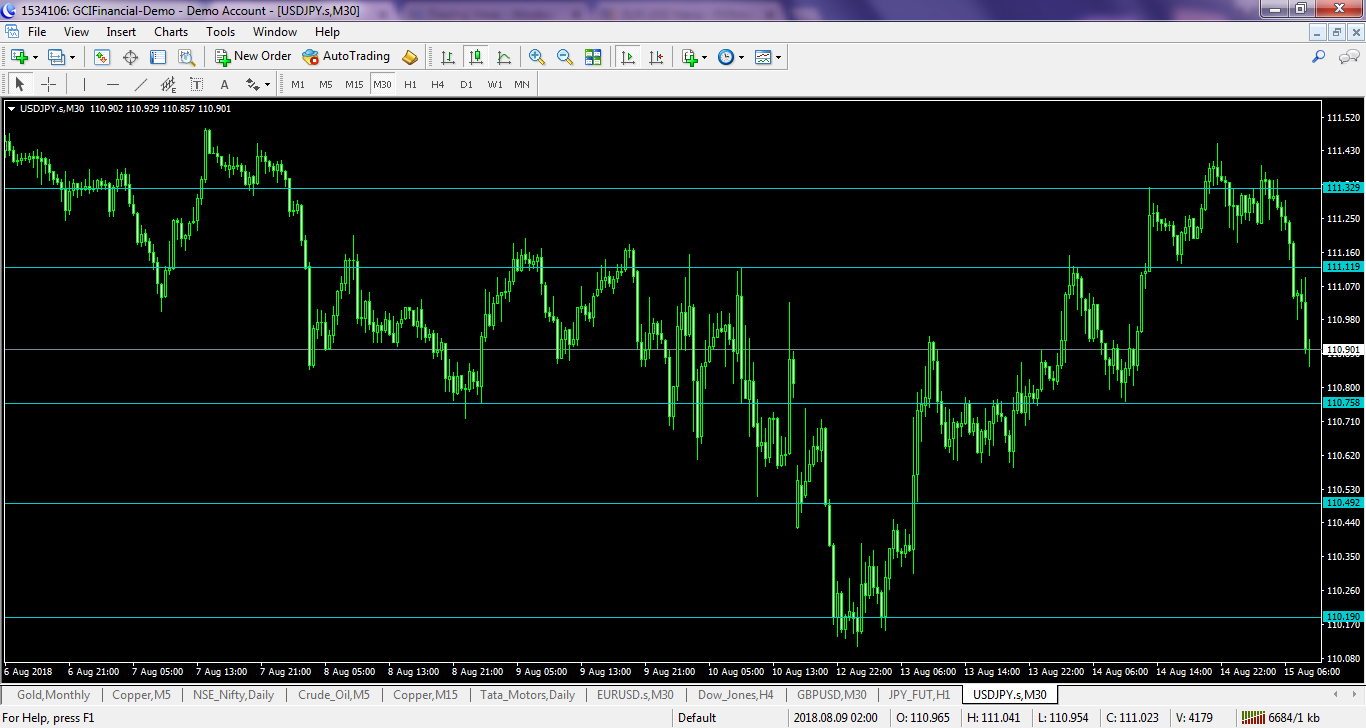
See the levels in the Chart and trade accordingly


Comments
Log in or sign up to join the conversation.