
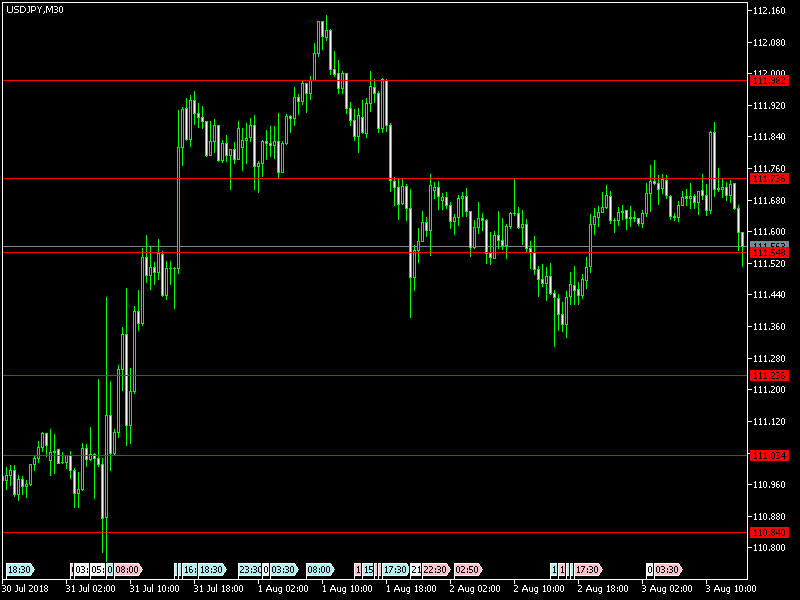
First, we look into the previous day trade and what happened on August 2, 2018, and it opened at 111.600 and went high at 111.741 and gone low 111.305 and finally closed at 111.637. The calculated pivot point for the day is 111.561.
The difference between high and low was nearly 0.436 points and there was a very good chance for trader to take the opportunity between low to high levels and finally benefited.
The pair is going to high levels from support levels, it may be bullish or bearish trend for today because of Non Farm Payroll data event time and trader should cautious since it reached over bought region and buy at support levels for more profits. Four hour chart followers may consider buy at 111.955, 112.688 and sell at 111.476, 110.828 levels.
LEVELS TO BE WATCHED FOR TRADERS FOR THEIR TRADING
|
Level |
First Level |
Second Level |
Third Level |
|
Selling Level |
111.00 |
110.70 |
110.25 |
|
Buying Level |
112.20 |
112.65 |
113.10 |
EVENTS TO BE OBSERVED AT THESE TIMES TO TAKE MORE ADVANTAGE
USDJPY FUNDAMENTALS TODAY
|
GMT |
Event |
Actual |
Previous |
|---|---|---|---|
|
00:30 |
JPY Markit Services PMI |
51.3 |
51.4 |
|
12:30 |
USD Nonfarm Payrolls |
213K |
|
|
12:30 |
USD Average Weekly Hours |
34.5 |
|
|
12:30 |
USD Labor Force Participation Rate |
62.9% |
|
|
12:30 |
USD Average Hourly Earnings (YoY) |
2.7% |
|
|
12:30 |
USD Average Hourly Earnings (MoM) |
0.2% |
|
|
12:30 |
USD Unemployment Rate |
4.0% |
See the levels in the Chart and trade accordingly
Comments
Log in or sign up to join the conversation.