
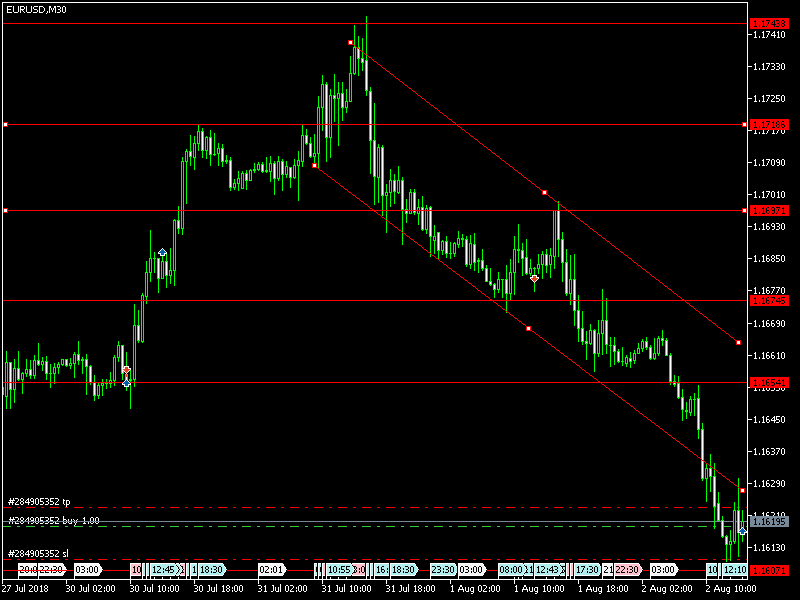
First, we look into the previous day trade and what happened on August 1, 2018 when it opened at 1.16900 and went high at 1.16986; then to low at 1.16565 and finally closed at 1.16605. The calculated pivot point for the day is 1.16718.
The difference between high and low was 42 pips and there was a good chance for a trader to take the opportunity and benefited.
For the last many days, this pair is moving from 1.1530 to 1.1790 levels, now it is going to lowest levels from previous low levels since dollar become strong due to some events. Four Hour chart followers & traders are waiting for an opportunity to buy at 1.16595, 1.16908 and sell at 1.16422, 1.15912 levels to get more profits.
BUYING AND SELLING LEVELS TO BE OBSERVED BY TRADERS
|
Level |
First Level |
Second Level |
Third Level |
|
Selling Level |
1.1618 |
1.1595 |
1.1572 |
|
Buying Level |
1.1654 |
1.1674 |
1.1697 |
TODAY EVENTS TO BE OBSERVED AND TRADERS SHOULD BE CAUTIOUS AT THESE TIMES AND TAKE ADVANTAGE OF THE EVENTS
EURUSD FUNDAMENTALS TODAY
|
GMT |
Event |
Actual |
Previous |
|---|---|---|---|
|
n/a |
EUR 10-y Obligaciones Auction |
1.422% |
1.308% |
|
n/a |
EUR 3-y Bond Auction |
-0.149% |
-0.098% |
|
n/a |
EUR 5-y Bond Auction |
0.368% |
0.313% |
|
09:00 |
EUR Producer Price Index (YoY) |
3.6% |
3.0% |
|
09:00 |
EUR Producer Price Index (MoM) |
0.4% |
0.8% |
|
n/a |
EUR 10-y Bond Auction |
0.74% |
0.67% |
|
11:30 |
USD Challenger Job Cuts (YoY) |
37.202K |
|
|
12:30 |
USD Initial Jobless Claims |
217K |
|
|
12:30 |
USD Continuing Jobless Claims |
1.745M |
|
|
13:45 |
USD ISM NY index - Business Conditions |
55 |
|
|
14:00 |
USD Factory Orders (MoM) |
0.4% |
|
|
14:30 |
USD EIA Natural Gas Storage change |
24B |
See the chart levels and trade accordingly
Comments
Log in or sign up to join the conversation.