

First, we look into the previous day trade and what happened on July 27, 2018, and it opened at 1.16448 and went high at 1.16635 and gone to low at 1.16196 and finally closed at 1.16559. The calculated pivot point for the day is 1.16463
The difference between high and low was 43 pips and there was a very little chance for a trader to take the opportunity and benefited.
For the last many days, this pair is moving from 1.1530 to 1.1790 levels, now it is going to the lowest levels from previous low levels since dollar become strong due to some events. Four Hour chart followers & traders are waiting for an opportunity to buy at 1.1680, 1.1733 and sell at 1.1634, 1.1603 levels to get more profits.
BUYING AND SELLING LEVELS TO BE OBSERVED BY TRADERS
|
Level |
First Level |
Second Level |
Third Level |
|
Selling Level |
1.1618 |
1.1595 |
1.1572 |
|
Buying Level |
1.1702
|
1.1724 |
1.1748 |
TODAY EVENTS TO BE OBSERVED AND TRADERS SHOULD BE CAUTIOUS AT THESE TIMES AND TAKE ADVANTAGE OF THE EVENTS
EURUSD FUNDAMENTALS TODAY
|
GMT |
Event |
Actual |
Previous |
|---|---|---|---|
|
09:00 |
EUR Services Sentiment |
15.3 |
14.4 |
|
09:00 |
EUR Economic Sentiment Indicator |
112.1 |
112.3 |
|
09:00 |
EUR Business Climate |
1.29 |
1.38 |
|
09:00 |
EUR Industrial Confidence |
5.8 |
6.9 |
|
n/a |
EUR 5-y Bond Auction |
1.82% |
|
|
n/a |
EUR 10-y Bond Auction |
2.77% |
|
|
12:00 |
EUR Harmonized Index of Consumer Prices (YoY) |
2.1% |
|
|
12:00 |
EUR Consumer Price Index (MoM) |
0.1% |
|
|
12:00 |
EUR Harmonized Index of Consumer Prices (MoM) |
0.1% |
|
|
12:00 |
EUR Consumer Price Index (YoY) |
2.1% |
|
|
14:00 |
USD Pending Home Sales (MoM) |
-0.5% |
|
|
14:00 |
USD Pending Home Sales (YoY) |
-2.2% |
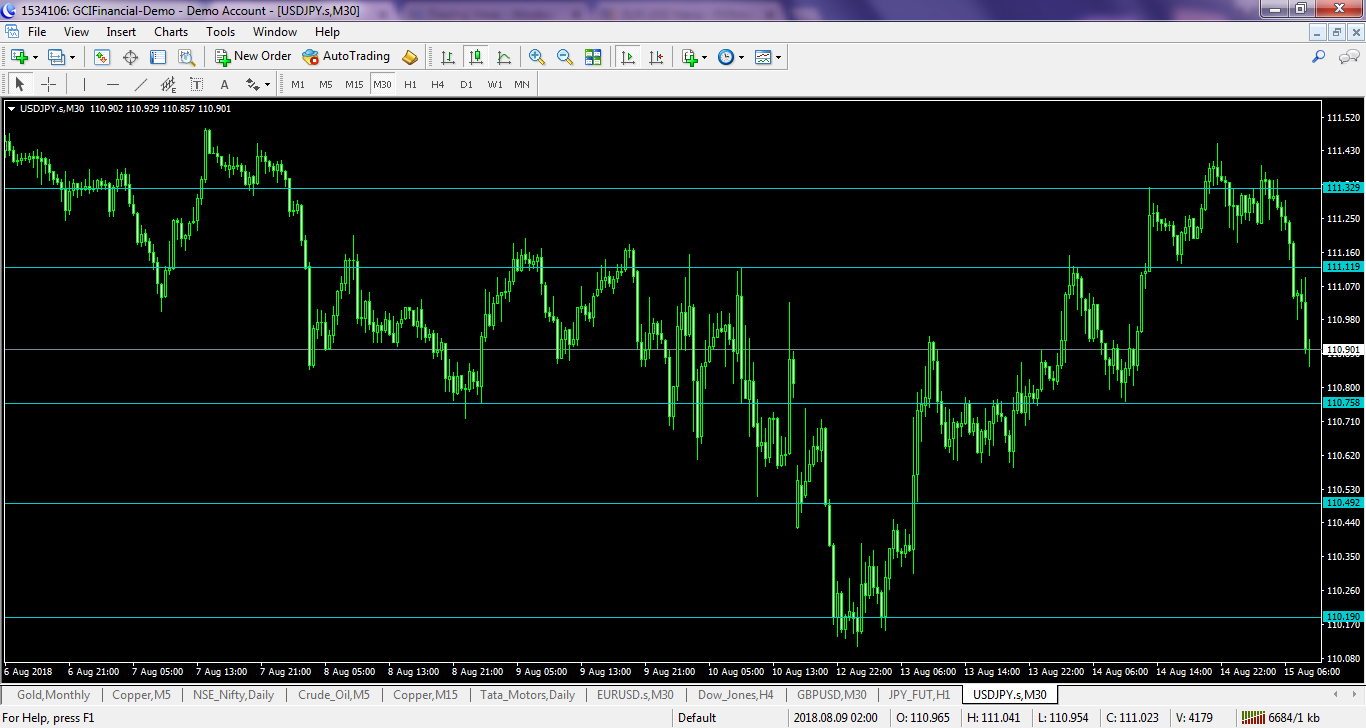
See the chart levels and trade accordingly


Comments
Log in or sign up to join the conversation.