

The bullets were flying on the front lines of the bond market last week. Much of the ordnance whizzing-by were fired by the Fed in the form of Fed member jawboning and decidedly hawkish minutes from the April FOMC meeting. The scuttlebutt is now that the Fed is going to hike in June. Although this is certainly possible, I am not yet ready to sound the all-clear.
Following signs that the U.S. economy has picked up speed from a sluggish first-quarter, Fed officials have begun to sound more hawkish. Even the doves have grown talons. I welcome this change as I believe that the Fed should have lifted-off in late 2014 or early 2015. However, a June hike remains far from certain. Fed officials point to improved data as reasons for the June meeting being live for a possible rate hike. However, economic data also contain signs that Fed tightening might not be imminent or long-lived.
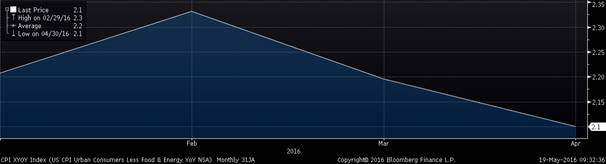
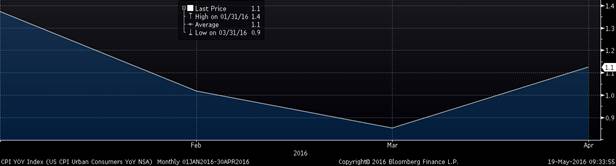
With oil prices rising since bottoming in the middle of February of this year, many (if not most) economists and market strategists have called for broadly rising U.S. inflation. My view has been (and continues to be) that as oil prices rise, consumers with healthier, but still constrained, household balance sheets might rein-in spending (in terms of dollars spent). This would likely result in a convergence of headline and core inflation. In my (oft-stated) opinion, this could materialize in the form of declining core inflation and rising headline inflation. Let’s take a look at CPI data since the beginning of the year.
Core CPI YoY YTD 2016 (Bloomberg):
Headline CPI YoY YTD 2016 (Bloomberg):
I find it interesting that Core PCE reached its near-term peak in February, a time when oil prices fell to their lowest levels since 2002. My hypothesis is that consumers were able to spend and push up prices in discretionary areas of the economy thanks, in large part, to lower fuel prices. As fuel prices climbed, consumers had to make a choice between curtailing spending or to go bargain hunting. I believe that it is no coincidence that the two retailers which reported the best earnings in the most recent quarter were Amazon (shopping destination of the price-conscious tech savvy consumer) and Wal-Mart (shopping destination of the budget-conscious less tech-savvy lower-income consumer). As wage gains have been moderate (at best), consumers were forced to deal with rising fuel prices by looking for cost savings in other areas of their lives. The argument that fuel prices remain low rings hollow with me because it is the journey rather than the destination which drives annual changes to economic data.
Under Pressure
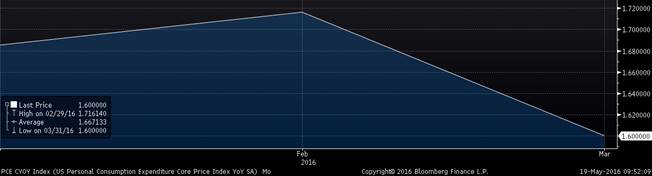
My belief is that inflation pressures will probably not be as strong as many economists believe. I believe that inflation should remain fairly contained with the Fed’s preferred measure of inflation (Core PCE) converging with headline PCE somewhere in the mid-1.00% area. We will not get the April reading of PCE data until May 31st, but if recent inflation trends hold true, we could see Core PCE decline while Headline rises. A look at the PCE data indicates that Personal Consumption Expenditures trends have taken on a similar pattern as CPI data, albeit at lower rates of inflation.
Core PCE YoY YTD 2016 (Bloomberg):
Headline PCE YoY YTD 2016 (Bloomberg):
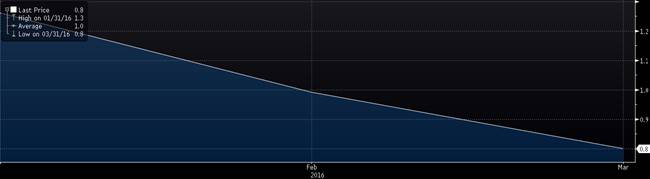
As you can see, Core PCE and Core CPI have been highly-correlated. However, Headline PCE has not tracked well with Headline CPI. I believe this is because PCE’s methodology is a different than CPI and has different data weightings than CPI. CPI also has a much higher rents weighting. PCE may be slower in capturing the rise in energy prices. I believe that Headline PCE should trend moderately higher, but Core PCE may rise little, be largely unchanged or, possibly, tick down a tenth or two.
We must also consider the impacts from tighter Fed policy. When the Fed tightens (or jawbones in that direction) it is considered to be anti-inflationary, at least from a currency and commodities standpoint. Thus, it was no surprise to me that that as Fed officials have begun to strike a hawkish tone, the U.S. dollar has strengthened versus most major currencies (especially the Japanese Yen).
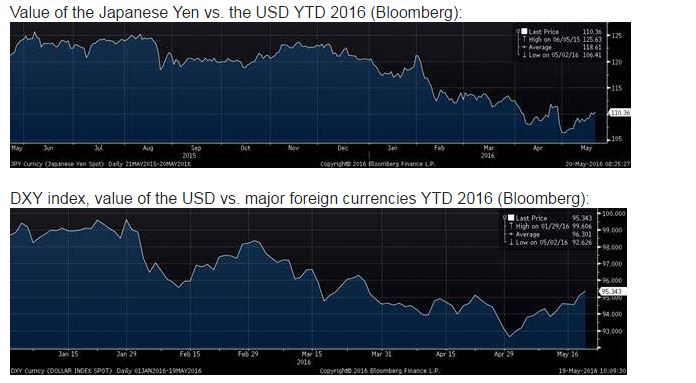
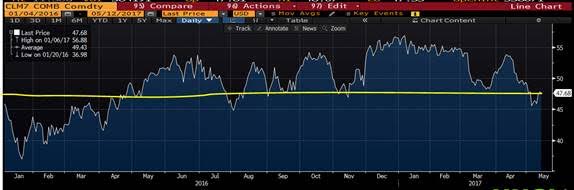
As economic data softened during the first three months of the year, the value of the USD weakened in the foreign currency exchange markets. However, something changed during the first week of May. The currency market took note of the somewhat more hawkish statement released on April 27th, following the FOMC meeting. After having a few days (including a weekend) to analyze the situation, the value if the USD began to trend higher. Stabilizing U.S. economic data and stable, but soft foreign economic data added fuel to the USD thrust. This upward trajectory of the USD blunted the rise of many commodities prices. However, it was not until the minutes of the April FOMC meeting were released that the strengthening U.S. dollar was able to overcome a falling rig count and supply disruptions, overseas in the oil market.
WTI Prices YTD 2016 (Bloomberg):
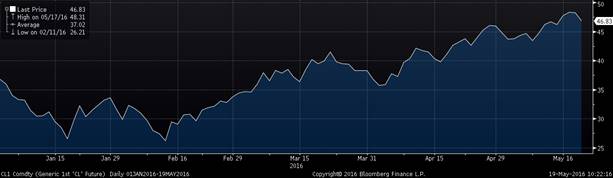
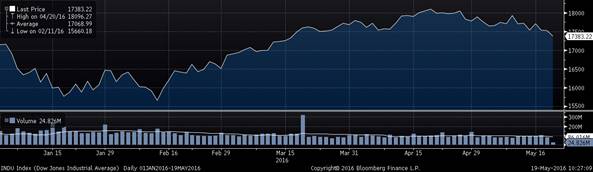
Admittedly, the recent decline of oil prices is somewhat modest, but it illustrates the impact the mere threat of bullish-dollar Fed policy can have on oil prices. Hawkish policy can also weigh heavily on the earnings potential of U.S. multinational companies. Both the Dow Jones Industrial Average and the S&P 500 indices contain a significant number of multinational companies, as well as energy companies, which tend to be negatively impacted by a stronger USD.
Dow Jones Industrial Average YTD 2016 (Bloomberg):
S&P 500 Index YTD 2016 (Bloomberg):
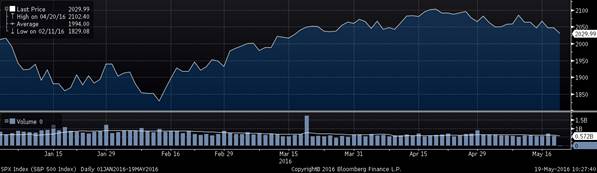
After rebounding nicely from recent lows in mid-February, U.S. large cap equity prices began falling (drumroll, please) around the time the Fed began to sound more hawkish. The more hawkish the Fed has sounded, the lower major indices have trended. The decline of small caps has been even more dramatic,
Russell 2000 Index YTD 2016 (Bloomberg):
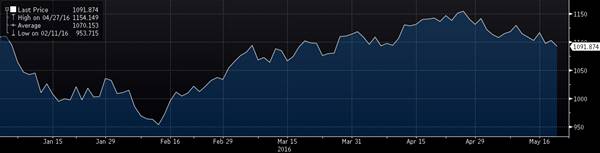
What is troubling to me is the lack of conviction among equity market participants. That some investors, portfolio manager or algorithms sell equities when it becomes somewhat more likely that the FOMC will raise the Fed Funds Rate by 25 bps (to an expected mid-band rate of 0.625%) speaks to the lack of confidence in the U.S. economy and the ability of U.S. companies (large and small) to expand profitability in the face of policy normalization.
Some readers might be puzzled as to why small cap stocks would react similarly as large cap stocks when small caps tend to have less foreign exposure than their larger brethren. For small caps, Fed tightening is not about a stronger dollar, but potentially higher borrowing costs. Many small cap companies have less-well-capitalized balance sheets than large cap corporations. This often results in more balance sheet leverage and lower credit ratings. Thus, small cap stocks can be negatively-impacted by tighter Fed policy. Most corporate debt issued by small cap companies are either shorter-maturity high yield bonds or floating rate loans. Higher short-term rates could result in small cap companies refinancing debt into a higher-rate environment and/or paying higher coupons on their floating rate debt (something that has not happened since the early 1980s). This could impair corporate earnings. Thus, small cap stocks are not always the safe haven from a stronger USD that they are purported to be. Although it might be true that they are less affected by a stronger USD than large cap companies, small caps can be nearly as negatively impacted by tighter Fed policies due to rising borrowing costs.
Emerging market stocks, bonds and currencies had benefitted from rising commodities prices (caused, in large part, by a weakening U.S. dollar). A potentially stronger USD as the, result of tighter Fed policy, could weigh heavily on EM investments.

Comments
Log in or sign up to join the conversation.