

Just in time for the module on fiscal policy in my macro policy course, multipliers in a time of COVID-19. From a CBO working paper by Selsiki, Betz, Chen, Demirel, Lee, and Nelson, “Key Methods That CBO Used to Estimate the Effects of Pandemic-Related Legislation on Output”.
Table 2 reports the ranges for a period of economic slack (empirical evidence in support of recounted in this New Palgrave survey article on multipliers), and then the adjustments made for social distancing.
(Click on image to enlarge)
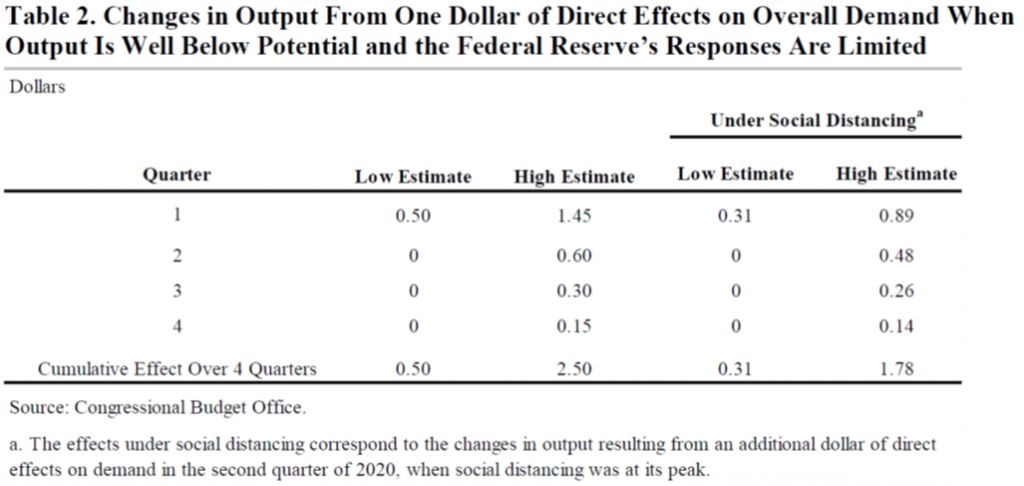
Source: Selsiki, et al. (2020).
The “direct effect” varies by measure (purchases of goods and services vs. unemployment insurance enhancement vs. PPP).
(Click on image to enlarge)
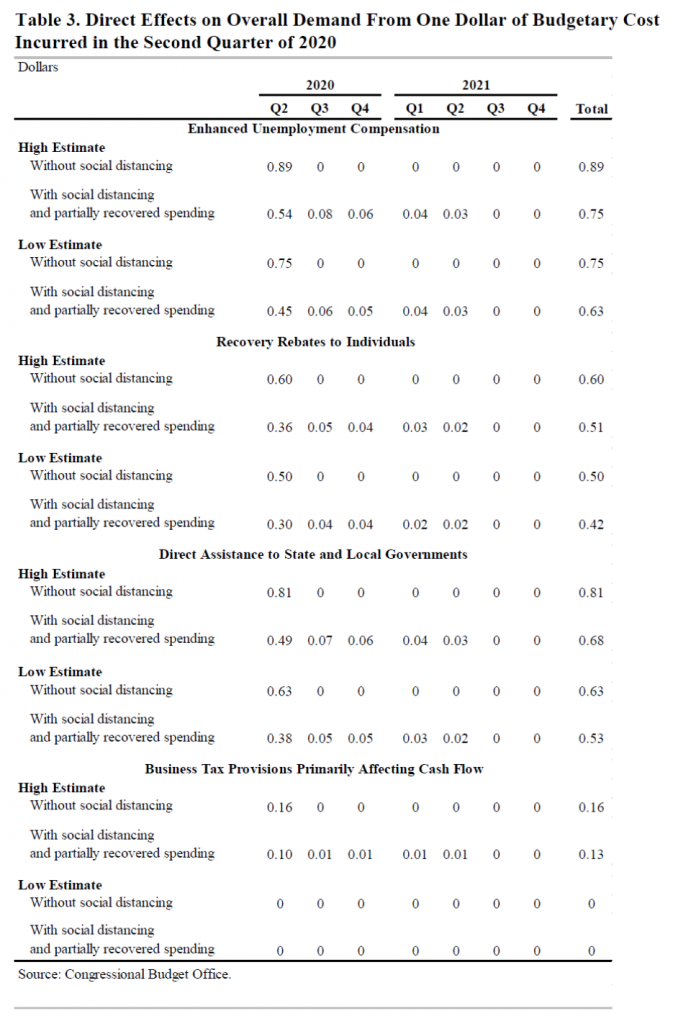
Source: Selsiki, et al. (2020).
Noteworthy is the fact that the demand multiplier for the Paycheck Protection Program is quite small; however, if we are interested in preventing the scarring effect due to massive bankruptcies of small and medium-sized firms, we might still view this measure as a net positive.
These estimates underpin the no-COVID legislation counterfactual described in this post from exactly one month ago.
(Click on image to enlarge)
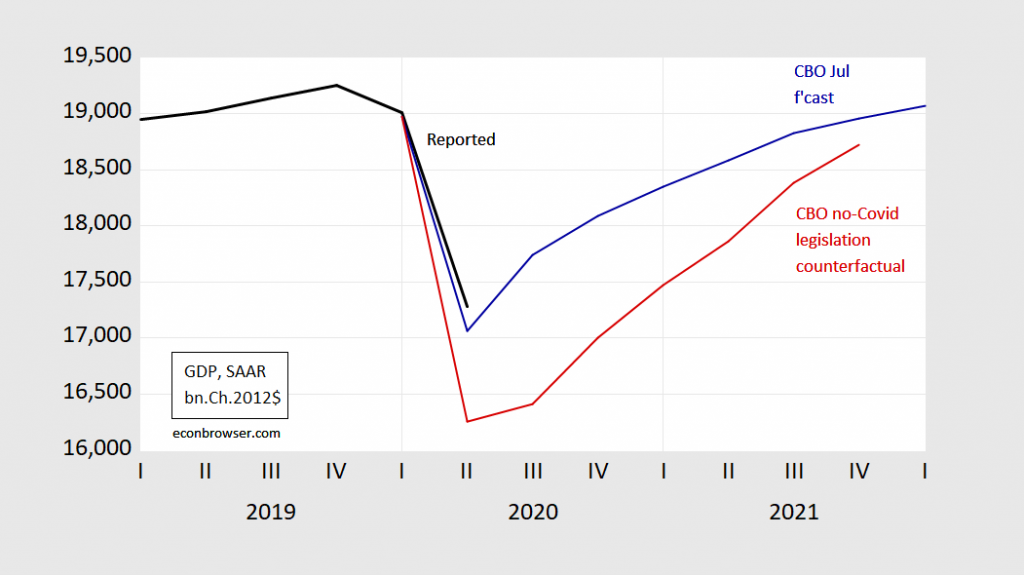
Figure 1: GDP as reported (black bold), CBO July 2020 projection (blue), CBO counterfactual of no pandemic related recovery legislation (red), all in billions Ch.2012$, SAAR. Source: CBO, The Effects of Pandemic-Related Legislation on Output (September 18, 2020), and author’s calculations.
Without the quick and substantial measures undertaken in the spring, we would be in a much deeper hole.
A prospective analysis of different spending packages — using a similar methodology — is provided by Wendy Edelberg and Louise Sheiner at Brookings here. The key graph depicts the impact on real GDP, for each $400 billion dollar package.
(Click on image to enlarge)
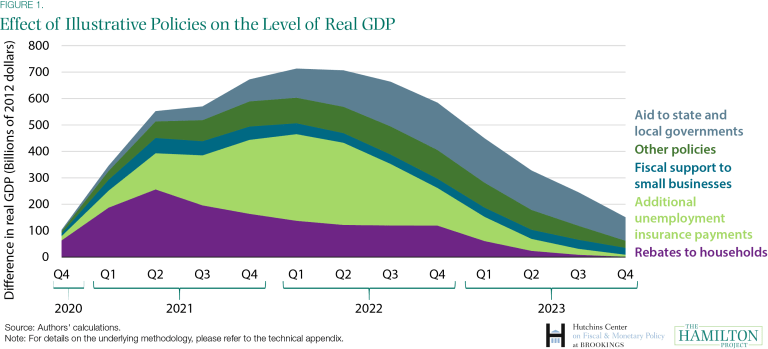
Source: Edelberg and Sheiner (2020).



Comments
Log in or sign up to join the conversation.