

On Wednesday, the 16th of March, all eyes will once again be on the Fed. It will be interesting to see if the US central bank will pick up the comments from Fed chairman Powell at his speech in Jackson Hole, where he said that the Fed is willing to allow inflation to run above the Fed target rate of 2% for a certain period of time.
In addition to the question of how the Fed addresses inflation, it will also be interesting to see how US equities will react to the rhetoric and if recent weakness, especially in US tech stocks, continues.
After the quickest 10% correction in the Nasdaq 100 ever: is the Fed forced to be Equity-friendly?
After the Nasdaq 100 saw its quickest 10% correction ever, it did not substantially recover. In fact, it reversed the first attempt last Wednesday, in which it saw its strongest day since April 2020 the day after. Many market participants are starting to wonder whether the Fed will allow volatility to rise and, thus, create the framework for a deeper drop below 11,000 points.
In general, we expect the Fed to reinforce its recent monetary policy stance but, all in all, with an "Equity-friendly" touch.
Looking back into the 1980s, we can see that that's in fact a quite likely outcome, and can be profitably traded:
- In particular, when the US yield curve was flat and volatility in US equities (measured via the VIX) was relatively high (which is currently the case), the 24 hours prior to the FOMC announcement was traded very profitably
- On average, nearly 80% of all profits in the S&P500 were made in the eight days leading up to the interest rate decision
- In other words: if you bought the S&P500 just 24 hours before the FOMC announcement, you would earn around 80% of the income of a buy-and-hold investor, but at a much lower risk because you were invested only 8 days a year.
One of the reasons why such a simple strategy works so well is probably because professional investors usually have a risk-overweight in their portfolio (which is probably especially true right now).
So, before a Fed rate decision, professionals tend to hedge their exposure and liquidity thins out, especially on the day before the Fed event itself. That results in a drift higher in equities, driven by small purchases, especially from smaller investors.
How to trade an SP500 CFD in this environment?
A trade could be initiated by the following three steps:
- We enter a long position in the SP500 CFD on Tuesday, September 15, 2020, at 19:55 CET 'Market' at the respective price at this time.
- A big disadvantage of this strategy is that it usually works without a Stop Loss. Since working with no clearly defined risk is no option for us as professional traders, we want to work with a worst-case stop based on volatility.
Therefore, we look at the Daily chart in the SP500 CFD, the indicator ATR(14) and at the average daily trading range of the last 10 trading days.
- The Daily ATR(14) reads ~72 points while the average daily trading range of the last 10 trading days has been ~87 points.
- Therefore, our worst case stop should be in the range between 70 to 90 points from our entry point in 1.
- We exit the Long position in the SP500 CFD on Wednesday, September 16, 2020, at 19:50 CET if it is not stopped out before.
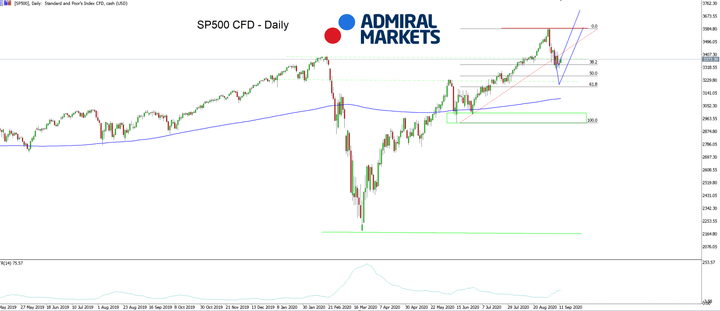
Source: Admiral Markets MT5 with MT5SE Add-on [SP500] CFD Daily chart (between 03 May 2019 to 14 September 2020). Accessed: 14 September 2020 at 10:00 AM GMT - Please note: Past performance is not a reliable indicator of future results, or future performance.
In 2015 the SP500 CFD fell by -0.73%, in 2016 it increased by 9.54%, in 2017 it increased by 19.42%, in 2018, it fell by -6.24%, and in 2019, it increased by 28.88%, meaning that in five years, it was up by 56.9%.



Comments
Log in or sign up to join the conversation.