
In last weekend’s video we noted the S&P 500’s trend still looked good, but that there was little margin for error. As we prepare for the most important day of the week (Friday), there are six areas that may attract buyers between 1992 and 1957:
- Price is at the bottom of the blue trend channel (see 1 in chart below).
- The 38.2% Fibonacci retracement from the October low to the December high sits at 1989. The S&P 500 closed at 1992 Thursday.
- The early January low was 1992.
- The mid December low was 1972.
- Price was rejected at 1970 in October (what once was resistance may now act as support).
The 50% retracement comes in at 1957.
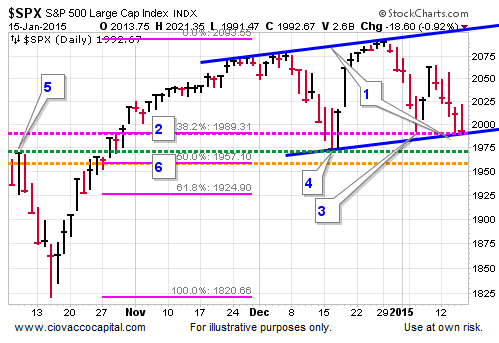
Our last two moves have been defensive in nature (sold tech stocks and bought bonds). If stocks cannot firm up before Friday’s close, the rules will most likely call for additional risk reduction. The levels in the chart above allowed for some patience this week, but the stock market’s margin for error is thin. Is it possible stocks break all six levels in the coming days? Yes, it is possible.
Other things to consider: (a) the market is closed on Monday, January 19, and (b) the ECB has an important announcement coming next Thursday. We will keep an open mind as things unfold Friday and next week.


Comments
Log in or sign up to join the conversation.