

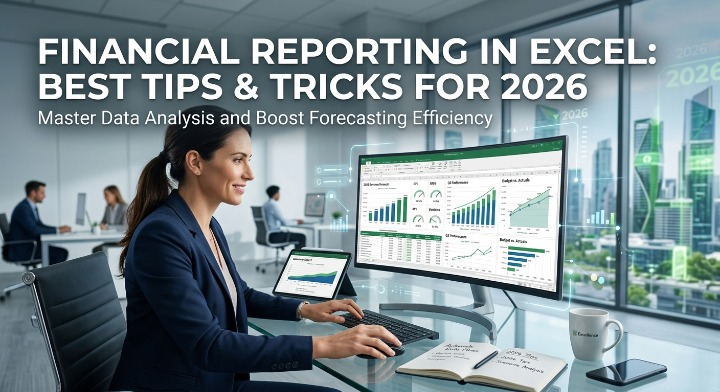
Every finance and accounting team knows the drill: month after month, the same reports need to be rebuilt, refreshed, and reformatted from fresh general ledger data. It's repetitive, time-consuming, and prone to small errors that can snowball into bigger misstatements. The good news is that a well-structured excel sheet can eliminate most of this manual grind — if you know which features to use and how to set them up correctly.
This is exactly the focus of an upcoming 2026 webinar led by Microsoft Excel expert David H. Ringstrom, CPA, president of Accounting Advisors, Inc. The session is built around one core idea: financial reporting doesn't have to be reinvented every period. With the right template, pivot table setup, and formatting techniques, your excel sheet can essentially refresh itself.
Why Reusable Templates Matter
The foundation of efficient financial reporting is a clean, reusable template. Instead of starting from scratch each reporting period, a properly designed workbook or worksheet becomes a stable starting point. You simply swap in new general ledger data, and the structure — formulas, formatting, and layout — stays intact. This reduces the chance of accidental errors that creep in when reports are rebuilt manually every time.
Building this kind of template starts with getting your data into Excel cleanly. That's where Power Query comes in — a tool for extracting, transforming, and loading data from text files, accounting systems, and other sources directly into your excel sheet. Once your data pipeline is automated, the rest of the reporting process becomes far more reliable.
Turning Raw Data into Instant Reports
One of the most practical techniques covered in this kind of training is using pivot tables to generate financial statements automatically from general ledger data. Rather than manually summarizing figures, you add rows to a blank pivot table and let Excel do the heavy lifting. The result is a report that updates the moment new data is loaded.
To make these reports more useful and readable, Slicers and Timeline filters let you refine the view instantly — filtering by category, department, or date range without touching a single formula. Slicers have been available since Excel 2010, while Timeline filtering was introduced in Excel 2013, so most modern versions of Excel support these features. For anyone working with a busy excel sheet full of transactional data, learning to trim pivot table output down to fewer, cleaner rows and columns can make the difference between a report that's usable and one that overwhelms.
Making Numbers Easier to Read at a Glance
Numbers alone don't always tell the full story — visual cues help. Conditional formatting tools like Data Bars and Icon Sets turn plain number lists into something that communicates trends and outliers instantly. A red icon next to a declining metric or a shaded bar showing relative size gives decision-makers context without requiring them to comb through every row of an excel sheet.
For more advanced visualization, combining VLOOKUP and MATCH functions allows you to summarize income statement data in a format suited for waterfall visualizations — a chart type that's particularly useful for showing how a starting figure is affected by a series of positive and negative changes, such as revenue moving to net income. Excel's built-in Waterfall chart, available from Excel 2016 onward, makes this kind of visualization far easier to build than in older versions where it had to be simulated manually.
Applying a consistent chart template across all your visualizations also matters more than people often realize. It keeps every report look and feel uniform, which builds trust and professionalism into your financial documentation.
Why This Matters for Different Excel Versions
Not everyone works in the same version of Excel, and that's an important consideration. Microsoft 365 is a subscription product that receives frequent — often monthly — feature updates, while perpetual versions like Excel 2021, 2019, 2016, and 2013 have fixed feature sets. Knowing which features are available in your specific version helps you avoid frustration when a technique demonstrated in a tutorial doesn't quite match what you see on your own screen.
Who Benefits Most
These techniques aren't limited to accountants. CPAs, CFOs, controllers, auditors, bookkeepers, tax preparers, financial consultants, and even IT professionals and marketers who regularly work with financial data can benefit from mastering these excel sheet strategies. Anytime reporting accuracy, speed, and consistency matter, these skills pay off.
Final Thoughts
Financial reporting will always involve deadlines and data, but it doesn't have to involve reinventing your excel sheet every single period. By combining Power Query, pivot tables, Slicers, Timelines, conditional formatting, and waterfall charts, finance professionals can build reporting systems that update automatically and look polished every time — freeing up hours that would otherwise go toward repetitive manual work.
FAQs
1. What is the main benefit of building a reusable excel sheet template for financial reporting?
It saves time and reduces errors. Instead of rebuilding reports from scratch each period, you just refresh the data while formulas and formatting stay intact.
2. Do I need an advanced version of Excel to use these reporting techniques?
Not necessarily. Most features like Slicers, pivot tables, and conditional formatting work in Excel 2013 and later, though newer tools like the built-in Waterfall chart require Excel 2016 or above.
3. Who should learn these excel sheet reporting techniques?
CPAs, CFOs, controllers, auditors, bookkeepers, tax preparers, and even non-finance professionals like IT staff or marketers who regularly work with financial data can benefit.
4. How do pivot tables improve financial reporting in an excel sheet?
They let you generate financial statements automatically from general ledger data, updating instantly as new data is added — no manual recalculating required.
Comments
Log in or sign up to join the conversation.