

The Federal Housing Finance Agency (FHFA) has released its U.S. House Price Index (HPI) for January. Here is the opening of the press release:
Washington, D.C. – U.S. house prices rose in January, up 0.3 percent from the previous month, according to the Federal Housing Finance Agency (FHFA) House Price Index (HPI). House prices rose 5.2 percent from January 2019 to January 2020. The previously reported 0.6 percent increase for December 2019 was revised upward to 0.7 percent.
For the nine census divisions, seasonally adjusted monthly house price changes from December 2019 to January 2020 ranged from -0.2 percent in the Mountain division to +0.7 percent in the South Atlantic divisions. The 12-month changes were all positive, ranging from +4.1 percent in the Middle Atlantic division to +6.4 percent in the South Atlantic division.
“U.S. house prices continued to increase at a moderate pace in January,” according to Dr. Lynn Fisher, Deputy Director of the Division of Research and Statistics at FHFA. “Transactions in January were unlikely to reflect much, if any, influence from the COVID-19 outbreak. House prices in the Pacific and South Atlantic regions grew somewhat faster over the year ending in January 2020 than observed the same time a year ago.” [Read more]
The chart below illustrates the monthly HPI series, which is not adjusted for inflation, along with a real (inflation-adjusted) series using the Consumer Price Index: All Items Less Shelter.
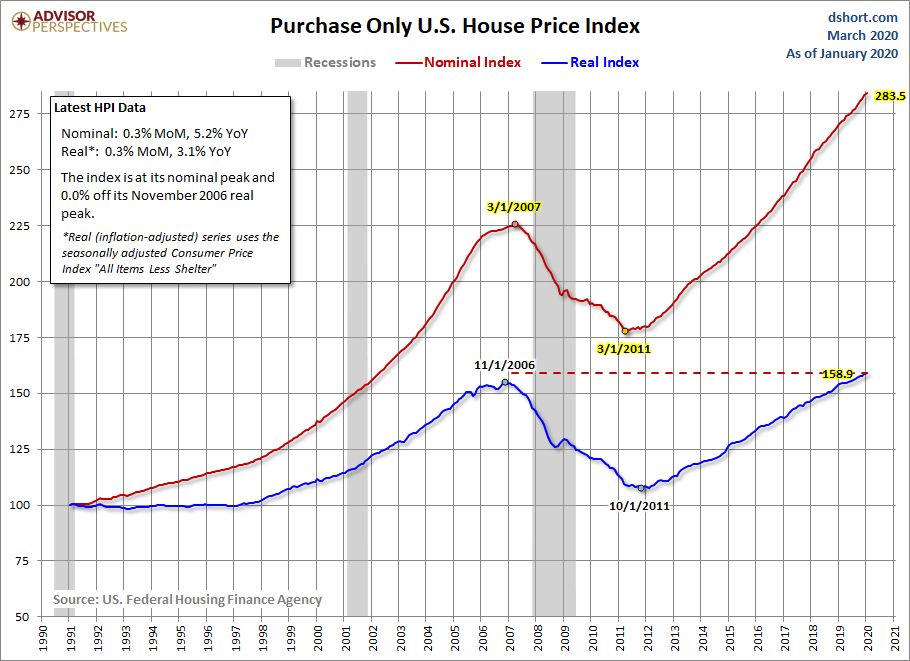
In the chart above we see that the nominal HPI index has exceeded its pre-recession peak of what's generally regarded to have been a housing bubble. Adjusted for inflation, the index is now at 158.9.
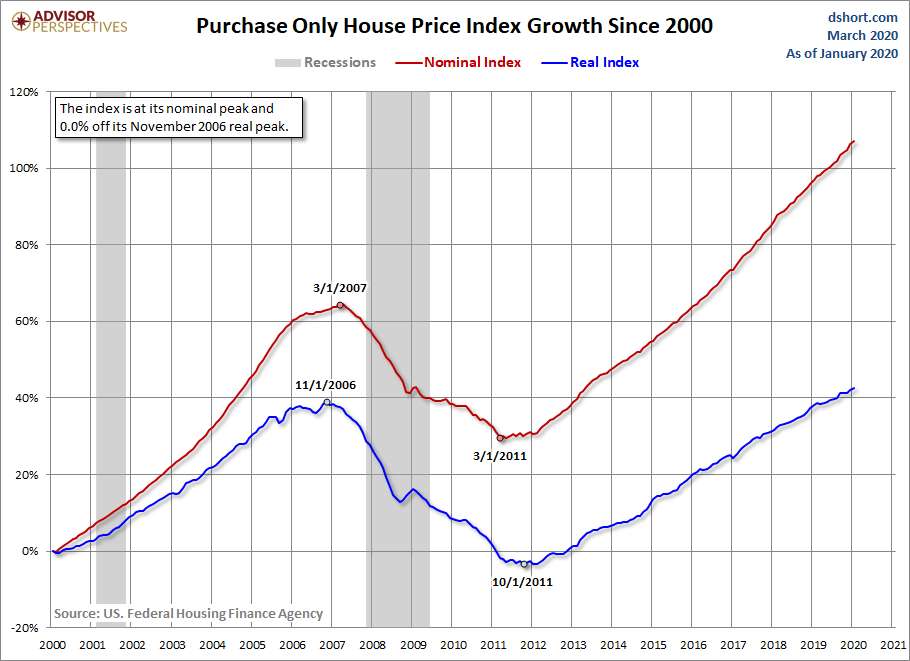
The next chart shows the growth of the nominal and real index since the turn of the century.
For an interesting comparison, let's overlay the HPI and the most closely matching subcomponent of the Consumer Price Index, Owners' Equivalent Rent of Residences (OER). Note: For an explanation of OER, see this PDF commentary from the Bureau of Labor Statistics.
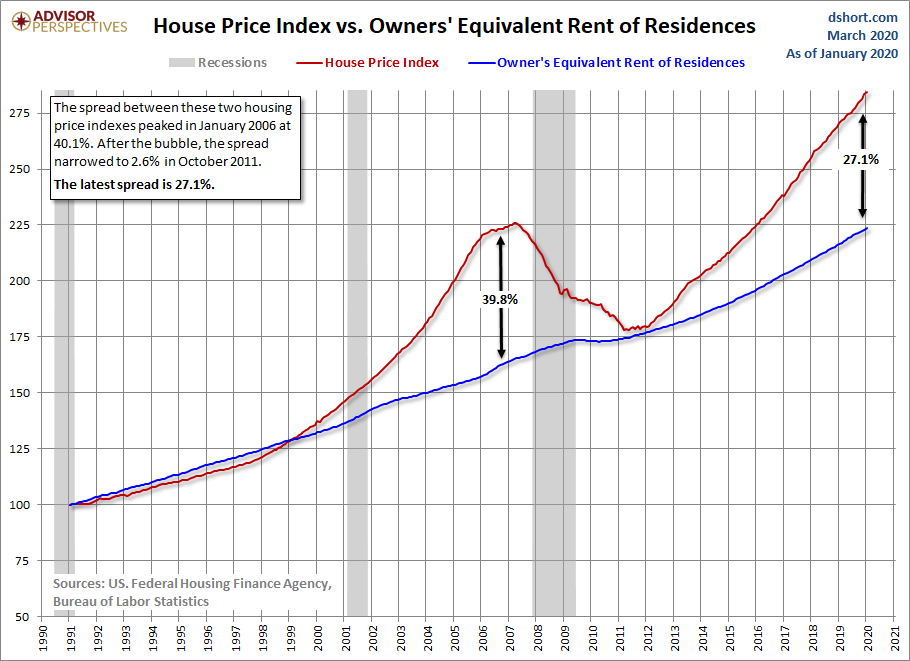
HPI and OER moved in close parallel from the 1991 inception date of the former until early 1999, when the two parted company and HPI began accelerating into the housing bubble. HPI then fell 20.7% over the next 48 months to its March 2007 trough. Confirmation of the "bubble" designation for house prices is the 40.1% spread between HPI and OER in January 2006.
Is another housing bubble forming? The current spread is 27.1%.
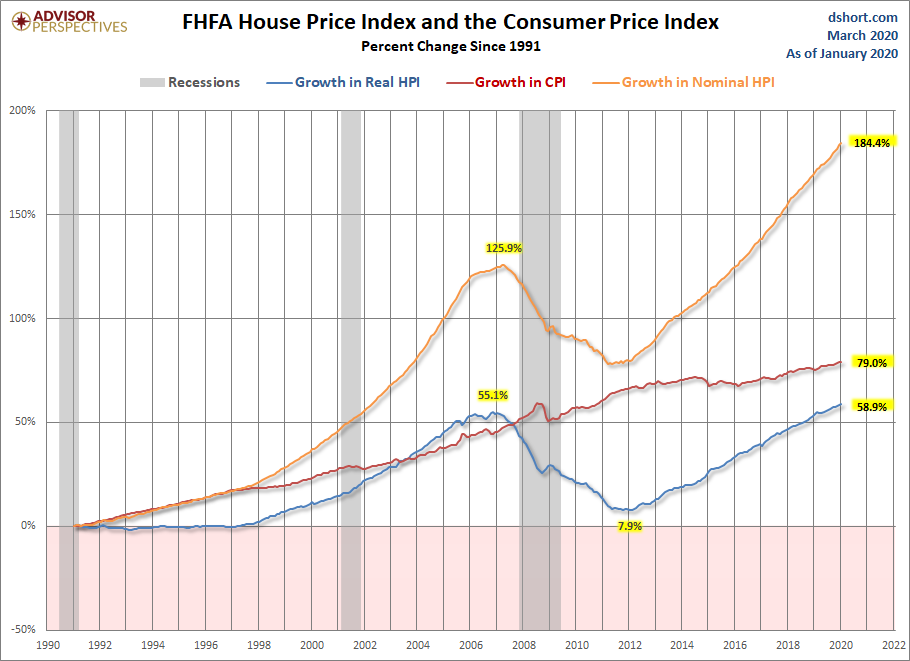
Here we compare the Consumer Price Index for All Urban Consumers to both the Nominal and Real House Price Index, which is a similar comparison to what we do in our Case-Shiller update. Nominal HPI growth has clearly taken off since 2012. However, when adjusted for inflation, the House Price Index has not seen as dramatic an increase since the late 1990s.



Comments
Log in or sign up to join the conversation.