

The United States Federal Reserve, a.k.a the Fed, approved a widely-anticipated interest rate cut on Wednesday 18 September. The quarter-point interest rate lifted the US dollar briefly but the divide among Federal Reserve members on what to do next has left the US dollar languishing. According to some however, the world's biggest currency may not stay there for long as the JP Morgan Global FX Volatility Index continues to warn of an imminent explosion in the US dollar.
Why did the Fed cut interest rates?
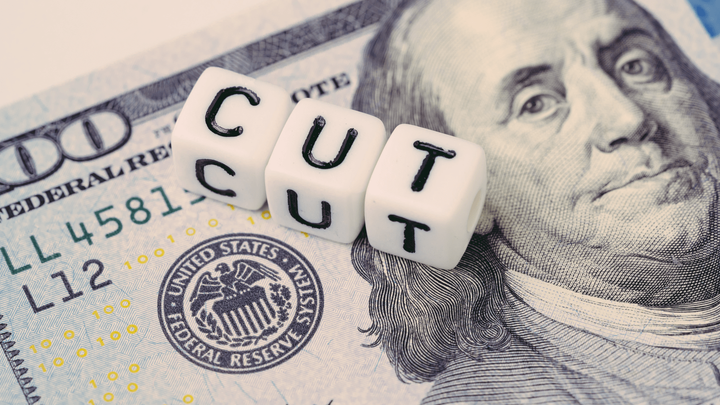
After two days worth of policy-meetings, the Fed decided it would take its benchmark overnight lending rate (or interest rate) to 2% from 2.25%, initially sending the US dollar higher before sinking back down in the next trading session. This was only two months after the Fed went ahead with its first interest rate cut in 11 years.
Federal Reserve Chairman Jerome Powell said "We took this step to help keep the US economy strong in the face of some notable developments and to provide insurance against ongoing risks". This is in reference to the slowdown in global growth and the ongoing US-China trade war.
US President Donald Trump expressed his displeasure via Twitter stating that "Jay Powell and the Federal Reserve Fail Again". The President has been calling for the Fed to cut interest rates more aggressively to make them more competitive on the global stage and - according to some analysts - to help Trump in his failing trade war with China.
What's next for the USD?
Currently, Federal Reserve policymakers are mixed on the next approach. This is due to the fact that the global economy is in a very fragile state with uncertainty regarding global growth and the US-China trade war. Typically currency traders move money to where they can receive a higher interest rate on their capital or at least believe a central bank is likely to increase rates at some point in the future. Currently, nearly all major central banks are cutting rates in an attempt to stimulate the global economy.
There are some indications that something will eventually 'break' in the future. According to JP Morgan's Global FX Volatility Index, an explosion in the US dollar is imminent. Currently, the index is sitting at five-year lows signaling that the volatility of the currency is quite low. However, over the past 25 years, there have only been three troughs in the index and each time the US dollar exploded 10%. The bank notes the index is now making a new fourth trough.
With this type of high level, fundamental analysis, it can still be tricky to find trading opportunities on something that could happen but is not happening right now. That's why many traders look towards technical analysis as well. Studying the price chart of security helps to understand the state of the market now, as well as provide clues on future direction. When this lines up with the bigger picture that's typically when stronger trends prevail.
Let's take a look at a chart of the US dollar index.
How to Trade the US Dollar Index (USDX)
The US dollar index is an index of the value of the US dollar against a basket of different currencies such as the Euro, British pound, Swedish Krona and more. With Admiral Markets you can speculate on the price direction of this index by using a CFD (Contracts for Difference). One of the benefits of this product is the fact you can go long or short on the market.
Many traders and analysts use the US dollar index CFD to identify a directional bias on the US dollar overall. This bias is then used to trade other US dollar currency pairs such as the EUR.USD, GBP.USD, USD.CAD and so on. However, traders can also trade the US dollar index CFD.
(Click on image to enlarge)
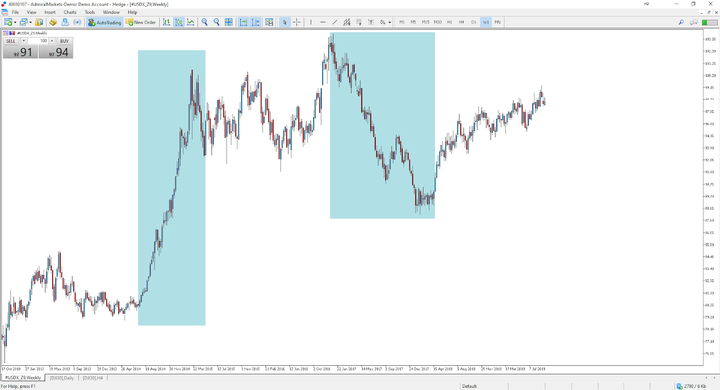
Source: Admiral Markets MetaTrader 5, USDX, Weekly - Data range: from 17 Oct 2010 to 19 Sept 2019, accessed on 19 Sept 2019 at 4:11 pm BST. - Please note: Past performance is not a reliable indicator of future results.
In the above weekly price chart of the US dollar index CFD, it is clear to see the long term trends in the US dollar from July 2014 to March 2015 and from January 2017 to February 2018, as highlighted in the blue boxes. While the US dollar has been rising higher since 2018 it has done so in a very narrow trading range, as shown below.
(Click on image to enlarge)
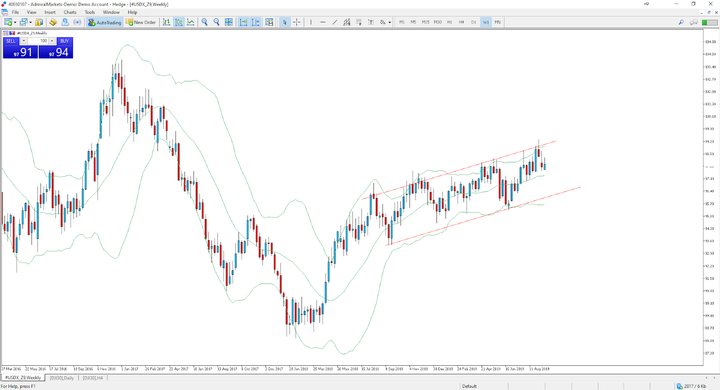
Source: Admiral Markets MetaTrader 5, USDX, Weekly - Data range: from 27 March 2016 to 19 Sept 2019, accessed on 19 Sept 2019 at 6:11 pm BST. - Please note: Past performance is not a reliable indicator of future results.



Comments
Log in or sign up to join the conversation.