
DAX30 CFD
The drop in global equities and the German DAX continued over the last week of trading, keeping the market sentiment anxious, and it seems as if bears are still not done on the downside.
What seems especially alarming is the very weak reaction to the Fed emergency rate cut last Tuesday.
While on Tuesday morning an emergency G7 phone call, lead by US Treasury Secretary Mnuchin and Fed Chair Powell didn't bring a coordinated action by the G7, not in regards to fiscal stimulus, nor in regards to a coordinated rate cut by central banks, but only some vague rhetoric that one will carefully watch the upcoming developments in regards to the Coronavirus and especially its impact on the global economy, the Fed stepped up several hours later.
The US central bank cut rates by 50 basis points, but Equity markets (and thus the DAX) only saw a short term squeeze higher, sold off sharply afterwards with 10-year US Treasury yields dropping significantly below 1.00% for the first time ever.
In our opinion that is a very weak sign and limits the upside potential in the German index in the days to come, even though there is currently an elevated chance of a very dovish ECB next Thursday (for details, please refer to the Euro paragraph below).
Even if bears loosen their grip a bit and the DAX bounces higher, a stronger zone of resistance should be found around 12,600 points.
On the downside a drop to fresh lows below 11,600 points activates 11,200 points and below 10,800 points as next targets:
(Click on image to enlarge)
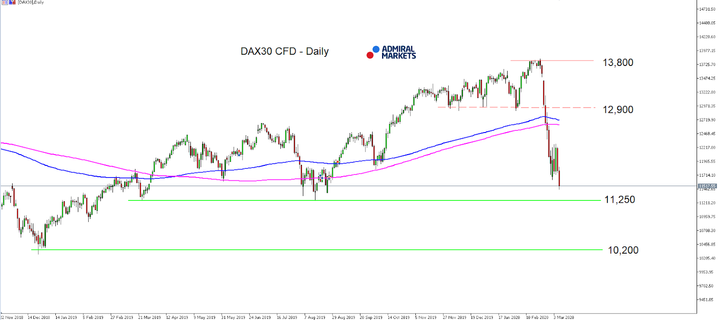
Source: Admiral Markets MT5 with MT5-SE Add-on DAX30 CFD Daily chart (between November 22, 2018, to March 6, 2020). Accessed: March 6, 2020, at 10:00pm GMT - Please note: Past performance is not a reliable indicator of future results, or future performance.
In 2015, the value of the DAX30 CFD increased by 9.56%, in 2016, it increased by 6.87%, in 2017, it increased by 12.51%, in 2018, it fell by 18.26%, in 2019, it increased by 26.44% meaning that after five years, it was up by 34.2%.
Check out Admiral Markets' most competitive conditions on the DAX30 CFD and start trading on the DAX30 CFD with a low 0.8 point spread offering during the main Xetra trading hours!
US Dollar
In our last weekly market outlook we wrote […]the worst in regards to the Coronavirus is yet to come and increasing chances of a surprising "emergency rate cut" from the Fed at their next meeting at the 18th of March, resulting in further USD weakness[…] and indeed: the Fed cut rates by 50 basis points last week on Tuesday.
Last time we saw such an emergency cut was in October 2008, the week when the Investment bank Lehman Brothers collapsed and with 10-year US Treasury yields dropping below 1.00% for the first time ever, the US dollar dropped significantly, too.
Technically, the mode in the USD Index Future switched to neutral with the spike below 96.00 points and thus the interruption of the long sequence, a sustainable drop below that level rather sooner than later with the Fed to be expected to ease further already at their next meeting on March 18, in the months to come, seems not a question of "if", but "when".
In fact, with the Euro having a weight of nearly 60% in the basket of the USD Index Future and us expecting fiscal stimulus instead of monetary stimulus from the EU/ECB (more details in the Euro paragraph below), with the Euro being expected to gain against the US dollar, further USD weakness seems likely and short-term bounces are probably making USD short-engagements more attractive from a risk-reward perspective.
A sustainable drop below 96.00 points make a drop down to 93.00 points in the USD Index Future likely:
(Click on image to enlarge)
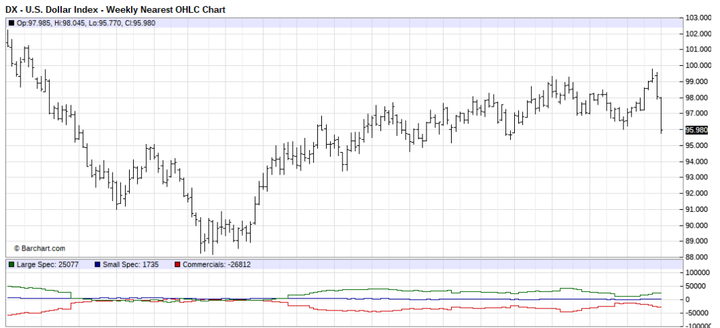
Source: Barchart - U.S Dollar Index - Weekly Nearest OHLC Chart (between January 2017 to February 2020). Accessed: February 28, 2020, at 10:00 PM GMT
Don't forget to register for the weekly "Trading Spotlight" webinar with presenters including Jens Klatt, every Monday, Wednesday and Friday at 2pm London time! It's your opportunity to follow Jens and others as they explore the weekly market outlook in detail, so don't miss out!
Euro
With fears among market participants of the potential global economic impact the spread of the Coronavirus might have, the emergency rate cut by the Fed last week on Tuesday around two weeks before their next meeting on the March 18, puts the main focus this week now on the ECB rate decision this week on Thursday.
In fact, market participants are expecting the ECB to ease now, too, cutting rates by 10 basis points and into negative territory, but also implement changes to bank lending – but we remain sceptical.
In our opinion, such decisions won't make a significant impact, not even short-term after years of easy monetary policy.
In our opinion this can clearly be seen in the latest inflation data from the Euro-Zone last Tuesday, hitting a three month low.
And this outlook for the EZ inflation remains true, even if ECB president Lagarde announces additional measures like especially supporting small and medium companies with even looser terms and conditions than other open-market conditions.
All this might prove meaningless without fiscal stimulus and running bigger government spending to fight not only the Coronavirus pandemic, but also the potential European economic downturn and being hit by a recession, also resulting out of an interruption of the supply chain from China.
With that in mind, such a 'fiscal stimulus step' seems inevitable from the EU and expecting especially monetary stimulus from the US instead of a fiscal one, our take for EURUSD is a bullish one, seeing the break above 1.1200/30 to be sustainable and let us expect further gains up to 1.1400/30 and even higher in the near-term:
(Click on image to enlarge)
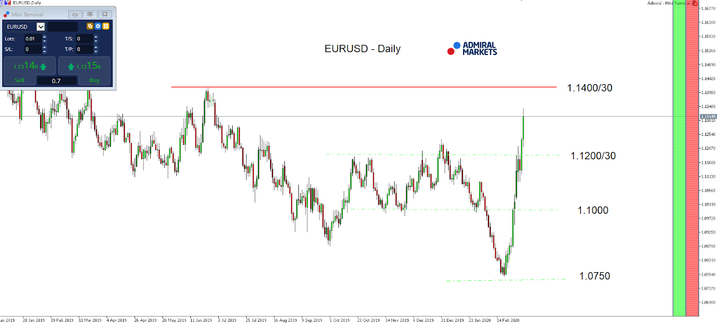
Source: Admiral Markets MT5 with MT5-SE Add-on EURUSD Daily chart (between January 4, 2019, to March 6, 2020). Accessed: March 6, 2020, at 10:00 PM GMT - Please note: Past performance is not a reliable indicator of future results, or future performance.
In 2015, the value of the EUR/USD fell by 10.2%, in 2016, it fell by 3.2%, in 2017, it increased by 13.92%, 2018, it fell by 4.4%, 2019, it fell by 2.2%, meaning that after five years, it was down by 7.3%.
JPY
As expected in our last weekly market outlook, chances seemed good that USD/JPY for an attack at the region around 107.80/108.00 if the Fed is forced to go with an "emergency rate cut", driven by US yields seeing a push lower.
And indeed: the Fed cut rates by 50 basis points last week on Tuesday, the first time since October 2008, the week when the Investment bank Lehman Brothers collapsed and with 10-year US Treasury yields dropping below 1.00% for the first time ever, pushing USD/JPY to its lowest levels since last October.
And while we stay sceptical in regards to the outlook for the Japanese currency in general after economic data from Japan massively disappointed in Q4 2019, elevated volatility, risk-off among market participants and a bearish outlook for US yields continue to favour the Japanese currency.
The main focus on the downside lies on the region around 105.00 where a break lower would activate the region around the psychological relevant and potential "action threshold" of the BoJ at 100.00.
Short-term bounces, probably driven by dovish comments and/or actions from the BoJ find a potential stronger zone of resistance around 107.80/108.00, before already around 106.80/107.00:
(Click on image to enlarge)
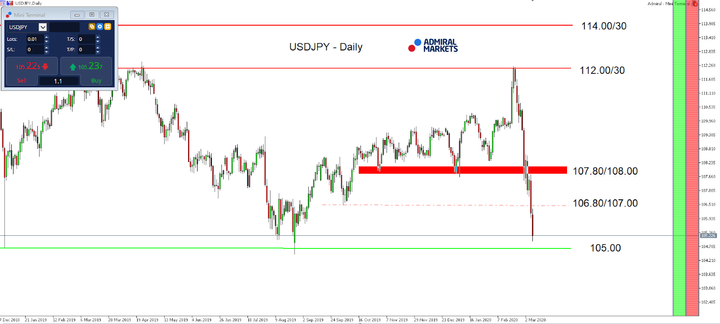
Source: Admiral Markets MT5 with MT5-SE Add-on USD/JPY Daily chart (between December 27, 2018, to March 6, 2020). Accessed: March 6, 2020, at 10:00pm GMT
In 2015, the value of USD/JPY increased by 0.5%, in 2016 it fell by 2.8%, in 2017, it fell by 3.6%, in 2018, it fell by 2.7%, in 2019, it fell by 0.85%, meaning that after five years, it was down by 9.2%.
Gold
While Gold surprised a little with weakness into the close of the month of February, Gold bulls went back on track over the last week with the precious metal pushing back above 1,600 USD and towards 1,700 USD.
As expected in our last weekly market outlook, chances seemed good that Gold could be driven higher if the Fed is forced to go with an "emergency rate cut", driven by US yields seeing a push lower.
And this "emergency cut" was indeed delivered, the Fed cut rates by 50 basis points last week on Tuesday, the first time since October 2008, the week when the Investment bank Lehman Brothers collapsed and with 10-year US Treasury yields dropping sustainably below 1.00% for the first time ever.
With volatility staying elevated and a clear risk-off bias among market participants while pressure on US yields should stay high, the outlook for Gold stays very positive and a break above 1,700 USD seems only a question of time.
Technically the mode stays bullish as long as we trade above the daily trend support which can still be found around 1,535/545 USD:
(Click on image to enlarge)
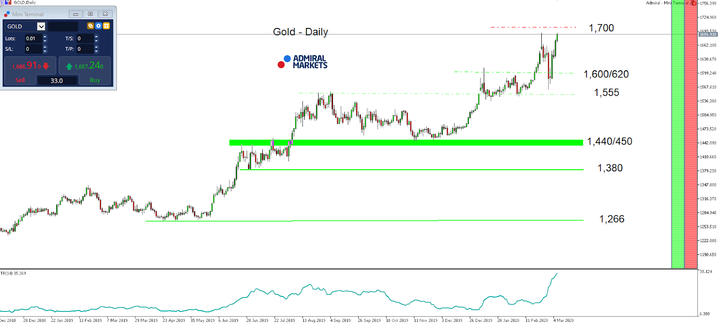
Source: Admiral Markets MT5 with MT5-SE Add-on Gold Daily chart (between December 5, 2018, to March 6, 2020). Accessed: March 6, 2020, at 10:00pm GMT - Please note: Past performance is not a reliable indicator of future results, or future performance.
In 2015, the value of Gold fell by 10.4%, in 2016, it increased by 8.1%, in 2017, it increased by 13.1%, in 2018, it fell by 1.6%, in 2019, it increased by 18.9%, meaning that after five years, it was up by 28%.


Comments
Log in or sign up to join the conversation.