
When I entered the fixed income business 26 years ago next month (and when I took over a fixed income trading book two years later), the fixed income business was a simple place. One judged credits on fundamentals, long-term rates on inflation expectations and forecast monetary policy by the thickness of Alan Greenspan’s brief case (the thicker the brief case the greater the chance for a change in monetary policy). We did not worry about quantitative easing. Corporate borrowers were allowed to default and, if necessary, fail. Market participants took their lumps like adults when an investment soured. No one expected the Fed (or anyone else) to bail them out. That all changed by the late early 2000s, when the Greenspan Fed displayed the tendency to ease policy at the slightest bit of market turmoil. This was known by market participants as the “Greenspan Put.” This was followed by the “Bernanke Put.”
No longer were market participants required to conduct deep analysis. One simply considered the credit rating, crunched the default probabilities through one’s favorite model and made a decision. If the models were wrong, few cared as the Fed was there to kiss one’s investment boo-boo and make it all better. I had hoped that this mentality was gone for good following the painful Financial Crisis. However, by 2012, wanton risk taking was occurring in the high yield debt markets.
The mantra being chanted in 2012 was: High yield corporate balance sheets were cleaner after the crisis, the Fed is going to keep rates low for a long time and will not tighten until the economy reaches escape velocity (which couldn’t be more than a year away). What investors and advisors were often not told was that, by investing in junk, they were helping to muddy those clean balance sheets. By 2013, it was becoming clear that the economy was not reaching “escape velocity.” Thus, all hope was placed on the “Fed Put.” By mid-2014, with energy prices starting to crack and Fed Chair, Yellen opining (correctly) that high yield looked frothy (and was ridiculed in the process), it appeared that a Fed Put was the only hope for the riskiest assets.
The Fed occasionally gave the markets what it wanted. It delayed tapering in September 2013 (launching it in December 2013). The Fed delayed tightening in September 2015 (launching it, for now, in December 2015), jawboning to support markets along the way. One could say the Fed had little choice as it received no help in the form of pro-growth fiscal policies and had to deal with foreign central banks (the ECB, BOJ, etc.) easing (also receiving little or no help on the fiscal side). The bond market changed from “Ozzie and Harriet” to Ozzy Osborne’s family. Dysfunction was normal.
Dysfunction is still the norm. The ECB engaged in negative interest rates last year. In 2014, the Bank of Japan embarked on another QE mission which included purchasing equities. Last week the BOJ announced that it would also engage in negative interest rate policy (NIRP). At the time of this writing, the JGB and German Bund yield curves looked like this:
Japanese and German Sovereign Yield Curves (Source: Bloomberg):
German sovereign debt yields do not go positive until the 8-year mark. Japan sovereign debt yields do not go positive until the 10-year mark. That’s right, boys and girls, you must pay the German government for the privilege of guaranteeing your money for as long as seven years. You must pay the Japanese government for the same privilege out to nine years. For readers who are new to fixed income and interest rate markets, this is dysfunctional with a capital D!
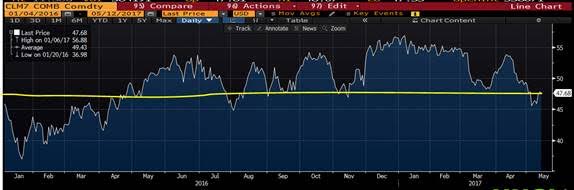
How anyone can use historical models to forecast interest rates, risk asset performance, economic growth or inflation in this world of financial and economic maladjustment. I continue to hear calls for rising long-term U.S. rates, in some case significantly higher long-term U.S. rates. Aside from the fact that inflation is mild and should continue as such, there is another reason long-term U.S. rates are probably not rising very much in the near future.
UST Yield Curve (Source: Bloomberg):
As you can see the UST curve is only negative out to… Wait a minute, it is not negative at all. In fact at about 1.84%, the 10-year UST note yield is about 154 basis points above the 10-year German bund yield and about 164 basis points above the 10-year JGB yield. The entire slope of the benchmark UST curve (2-years to 10-years) is only about 114 basis points (the flattest it has been since January 2008). Thus, investing in the 10-year UST note instead of the 10-year DBR or 10-year JGB appears to make a lot of sense. When you consider the demographic demand for reliable income and the fact that the U.S. Treasury plans to reduce the size of long-term debt issuance, one is hard pressed to make a case for significantly higher long-term U.S. interest rates, in the near future.
In spite of all the evidence for lower rates for longer, I continue to read and hear forecasts of a 2.75% or 3.00% 10-year UST note yield by year-end 2016. Now anything is possible. What is going to happen? Is about half of the population over 60 going to die by 12/31/16? Maybe this is the Zika virus strategy. Maybe China is going to build a few more unneeded cities the size of Atlanta? Maybe policymakers and consumers in Japan and Europe will all join a Ronald Reagan/Margaret Thatcher cult and become supply-side capitalists. None of these are likely, are they? Long-term rates could, possibly, rise through the low 2.00%s, but beyond that seems unlikely in my opinion. One of my former colleagues at Citi, who is also engaged in the fixed income portfolio business (and is darn good at it) opined a while back, when the 10-year UST note was yielding in the low 2.0%s, that we could see a 1.75% 10-year note before we see a 2.25% 10-year note. I believe he will probably be proved correct.
What are the “high-rate” rate folks seeing that the in the trenches bond guys aren’t? Apparently, they are looking at past precedents and are assuming that history will repeat itself. Please tell me the last time German interest rates were negative until 8 years out on the curve and Japanese interest rates were negative out until 10-years on the curve? When was the last time, as Cumberland Advisors’, David Kotok recently pointed out, that 23 countries in which a quarter of global GDP is produced were engaged in negative interest rate policy? The answer is: Never. This is insane. It would even be funny, if it wasn’t true.

Comments
Log in or sign up to join the conversation.