

Duke University surveys CFOs for their economic outlook. Results from a few weeks ago found over 80% expect a recession by the end of 2020. Maybe they are right and maybe wrong, but the question certainly deserves careful watching. Recessions can be mild or severe but typically are not friendly to stocks.
The level, pattern and direction of interest rates are among the more reliable indicators of forward economic activity. No indicator is perfect, but interest rates should not be ignored.
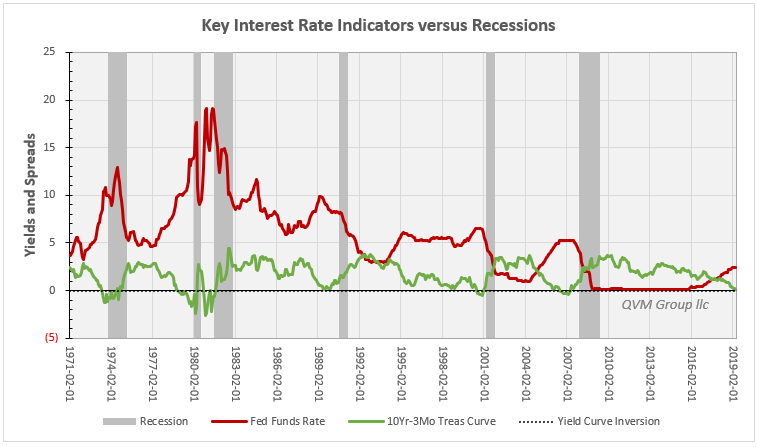
Treasury yield curve inversion (short-term rates being higher than longer-term rates – most importantly the 10-yr rate minus the 3-mo rate) has provided pretty good indication of approaching recession, but with some false positives, as documented by the New York Fed. Our observation is that if yield curve inversion is accompanied by the Federal Reserve cutting the Fed Funds Rate (typically an attempt to stimulate the economy), that pair has fewer false positives and might reasonably be used as a signal to be more defensive.
Right now there is yield curve inversion below the 10-year maturity level, but creeping up toward that level; and the Fed Funds futures market is strongly betting on cuts in that rate between now and January 2020. Additionally, the Fed has paused its rate increases and some of its voting members are equivocating about whether a cut is possible or likely.
Here is the yield curve picture:
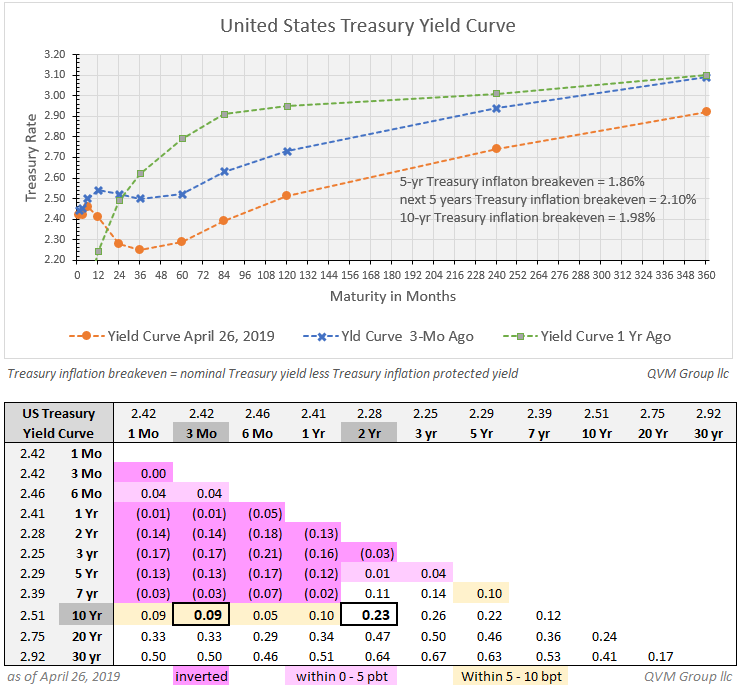
The green curve is the yield curve 1 year ago – steep and normally shaped with shorter-term rates lower and longer-term rates higher. The orange curve is the yield curve now – inverted all the way out to 7 years; and closing in on the 10-year Treasury. The blue is from 3 months ago. We show that because the New York Fed said that transitory inversions are not good signals, but that inversions that last at least 3 months are good.
If you prefer data tables to chart pictures, the table below the chart is a matrix of rates showing inversion in pink and near inversions in yellow.
While the official Fed “Dot Plot” of the separate anonymous forecasts of future Fed Funds rate levels by the FOMC voting members shows an upward slope for rates, those placing bets in the futures market are decidedly looking for a downward movement in the Fed funds rate. If that comes true and the yield curve is also inverted, then stocks are likely to do poorly not long after.
Here are the Fed Fund rate probabilities calculated by the CME futures exchange.
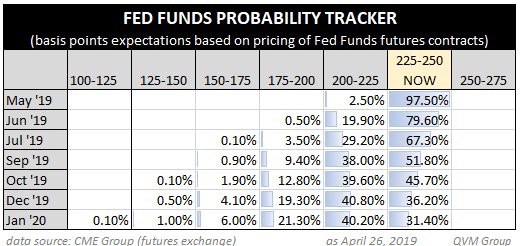
You can see that by January 2020, the probability of a Fed Funds rate decrease is over 68%, based on Fed Funds futures contracts, which are traded predominantly by professionals (not retail investors). These numbers are volatile and could change rapidly, but they have been trending for months toward a rate cut.
This chart shows the relationship of 10-yr/3-mo yield curve inversion (green) and declines in the Fed Funds rate (red) to recessions (gray vertical bars) since 1971.
In spite of stock market increases, and in combination with declining stock earnings forecasts, these interest rate data may suggest that the stock market is not so much good, as possibly too good.
A defensive equity posture is not imprudent.

Comments
Log in or sign up to join the conversation.