

The Economic Report of the President, 2020 is out as of today. Chapter 9 presents the underpinnings for the seemingly implausible GDP forecast presented in the Budget last week — a forecast that’s a full percentage point faster than CBO’s.
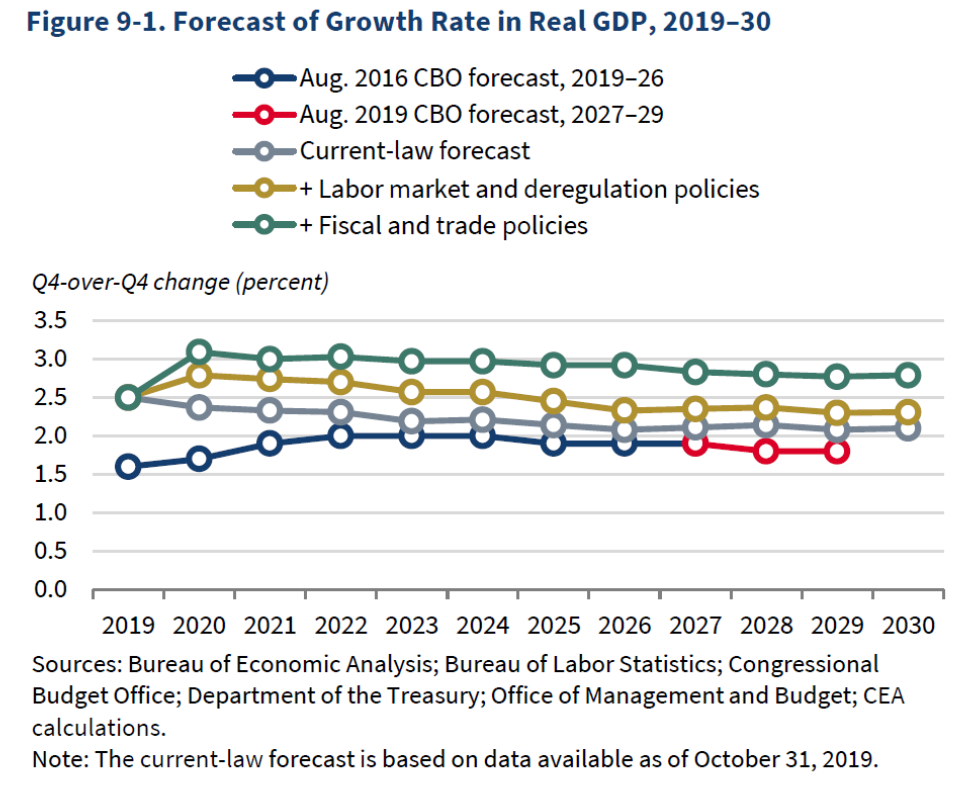
Source: Economic Report of the President, 2020.
This figure highlights the fact that the out-year forecasts are driven by the implementation of deregulatory initiatives and trade liberalization. From page 297:
we have decomposed this forecast into a current-law baseline and intermediate and top lines that reflect estimated growth effects discussed in this Report, as well as in the 2018 and 2019 Reports and the President’s Fiscal Year 2021 Budget. We then build up to our top-line, policy-inclusive forecast by successively adding to the current-law baseline the estimated effects of future deregulatory actions, immigration reform, additional labor market reforms to incentivize higher labor force participation, rendering the individual provisions of the Tax Cuts and Jobs Act (TCJA) permanent, additional fiscal policy proposals, including the Administration’s infrastructure plan, and improved trade deals with international trading partners. The top-line forecast constitutes the Administration’s official “Troika” forecast of the Council of Economic Advisers, Office of Management and Budget, and Department of Treasury. For comparison, we also report a pre-policy baseline consisting of the Congressional Budget Office’s 2019–27 projection made in August 2016, extended by its August 2019 current-law projection.
So while Administration forecasts are always conditional on implementation of Administration proposals (and CBO projections are conditional on current law), this year the implications are larger because (1) the implementation of initiatives are so implausible (still waitin’ for that infrastructure bill), and (2) the implied effects — particularly attributed to deregulation — are so questionable.
To reiterate, the Administration’s forecast looks implausible from the perspective of a naive time series model:
(Click on image to enlarge)
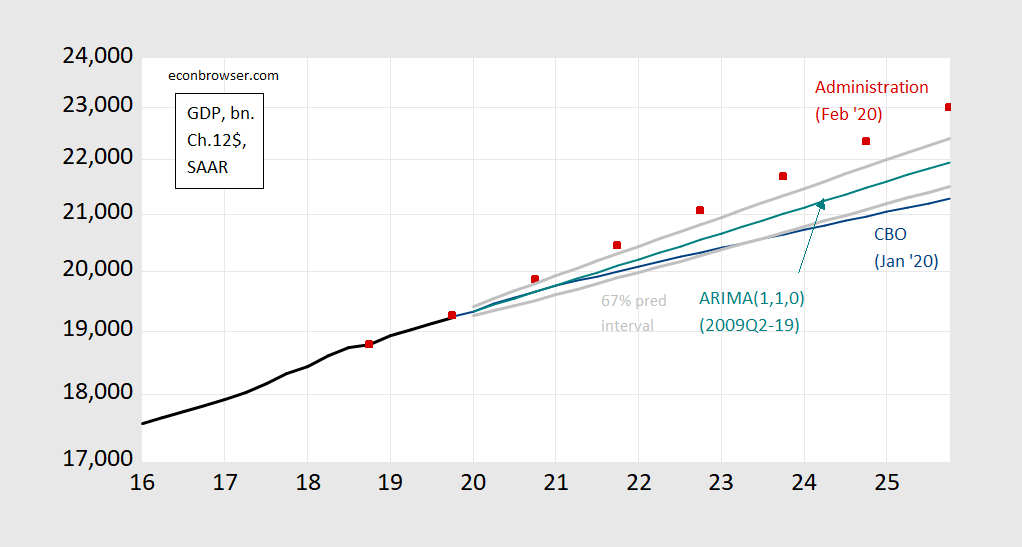
Figure 1: GDP in bn Ch.2012$ SAAR as reported (black), Administration forecast (red square), CBO January 2020 projection (blue), ARIMA(1,1,0) on log GDP 2009Q2-2019Q4 (teal), and 67% prediction interval (gray lines). Source: BEA, 2019Q4 advance release, CBO, Budget and Economic Outlook, January 2020, OMB, Budget for FY2021, February 2020, Table S-9, and author’s calculations.


Comments
Log in or sign up to join the conversation.