

Summary: The weight of the evidence still indicates that the primary trend remains firmly higher. But it also points to a pickup in vol and downside risk in the coming weeks as we enter a buyback blackout window during the market’s worst two-week seasonal stretch, while breadth has begun to roll over. We are not calling for a major selloff, but we do believe a 3–5% pullback over the coming month is likely. That would give an otherwise listless market renewed fuel for the next leg higher into the midterms.
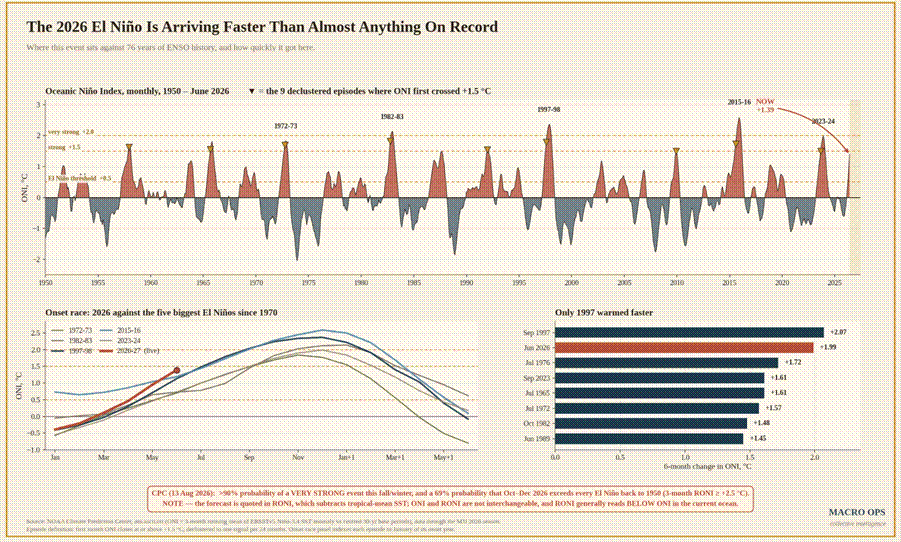
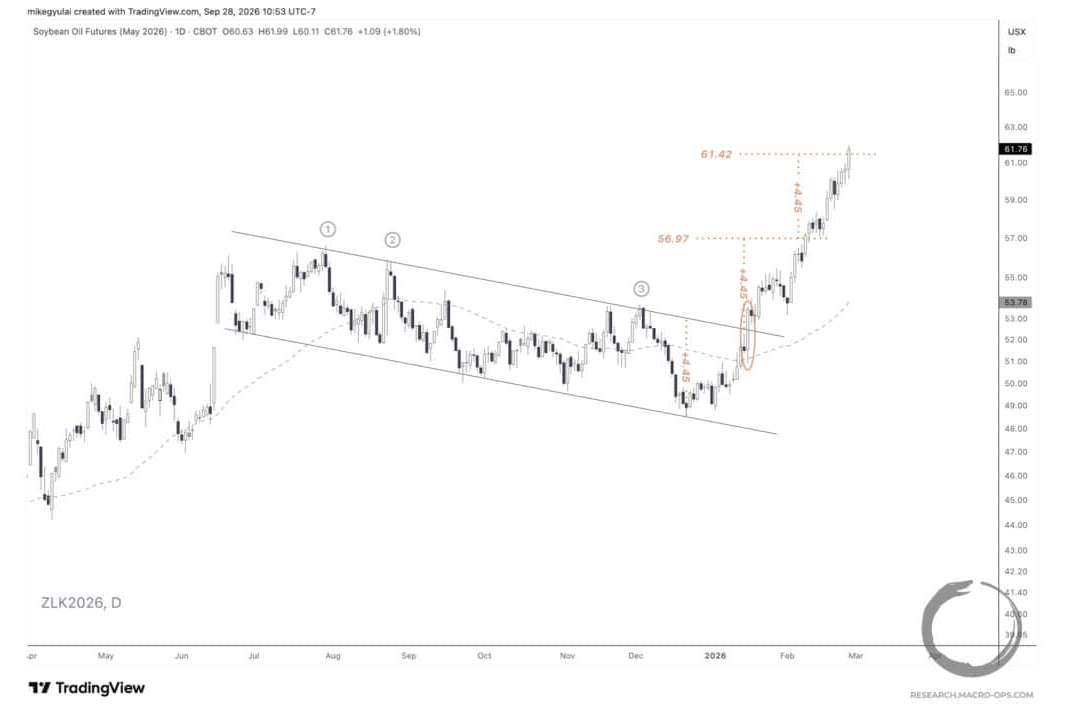
Agriculture remains our focus. This El Niño is arriving faster than almost all comparable events on record, while global temperatures continue to provide a strong 12-month lead on food prices. The Bloomberg Agriculture Index posted a strong monthly close in August, and history suggests this trend may only be getting started. Finally, we lay out the long setup in Brent crude.
MO Portfolio & Trades
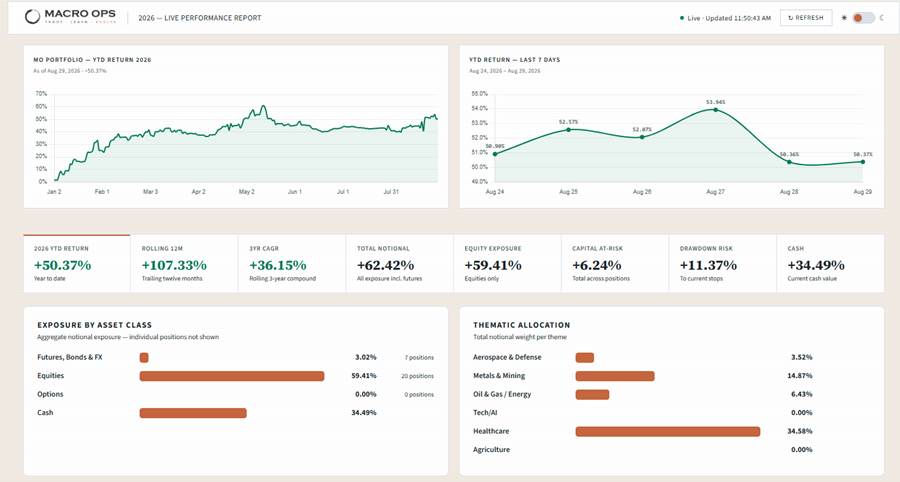
1. The portfolio fell -53 basis points last week, leaving us +50.37% on the year, below our ytd high-water mark of +61%. We’re very long Ags, PM miners, a little ETH. Long biotech, healthcare, defense, and natty producers. Short Dow and copper.
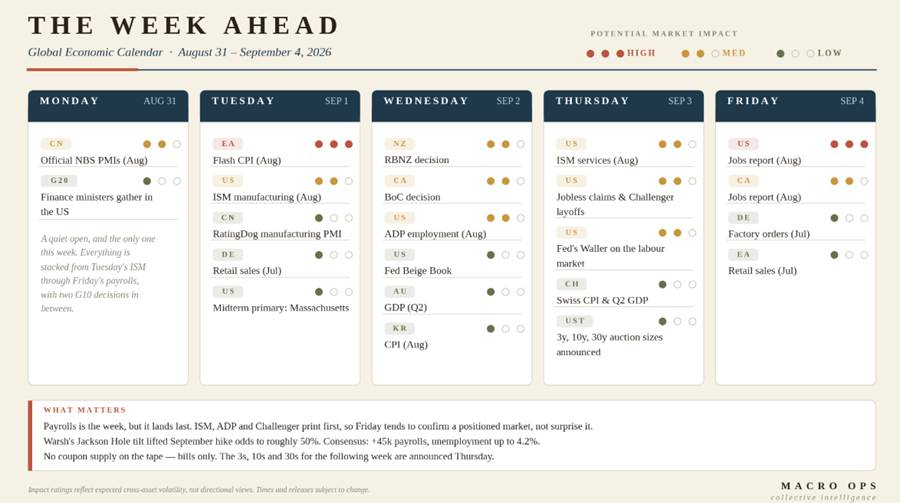
2. The week ahead in data: Payrolls arrive Friday. ISM, ADP, and Challenger data come first, so Friday is more likely to confirm an already positioned market than deliver a major surprise. Warsh’s Jackson Hole remarks lifted the odds of a Sep hike to roughly 50%. Consensus expects 45,000 payroll gains and unemployment to rise to 4.2%
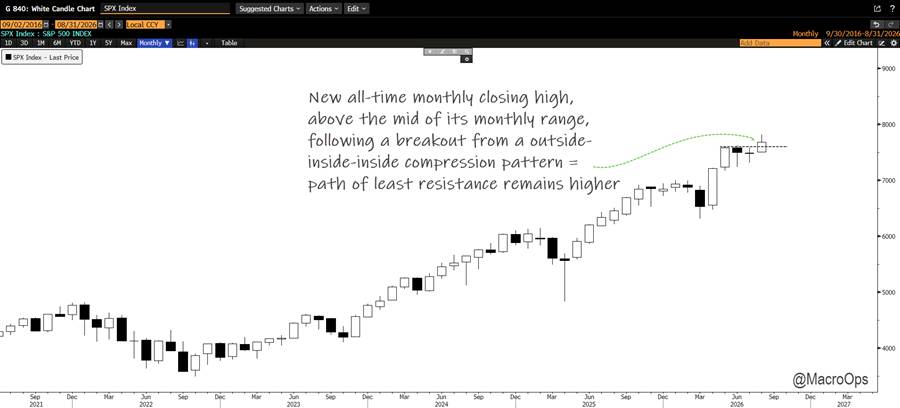
3. The end of August gives us a new set of monthly charts to review and assess what the tape — bar by bar — is telling us. The SPX monthly chart is below. Aug delivered a new all-time closing high and a breakout from its outside-inside-inside wedge compression. The month also closed just above the midpoint of its range, leaving a decent-sized upper wick
What does that tell us?
New all-time monthly closing highs are bullish: a trend in motion tends to remain in motion roughly 80% of the time. At the same time, the small body and large upper wick signal some indecision and a reluctance among bulls to press here. That suggests volatility and indecision may persist through September before the market retests or breaks above its August highs.
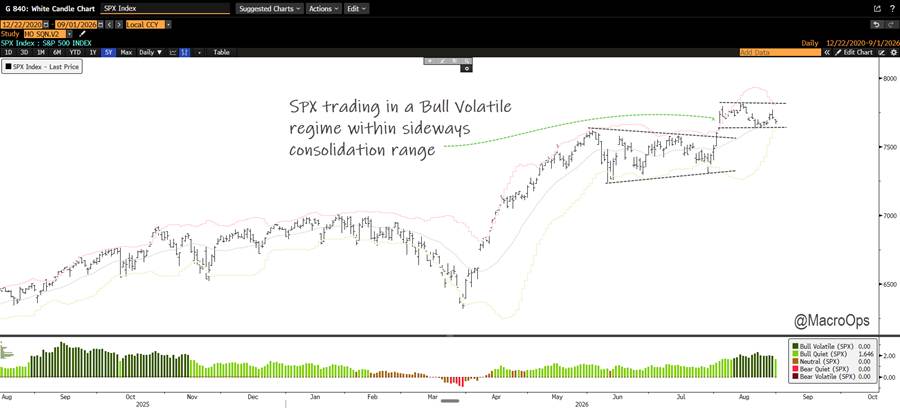
4. SPX is trading within a Bull Volatile SQN regime, within a sideways consolidation on the daily. While the path of least resistance remains higher on the primary trend, the current data read suggests a small washout below its current range is likely before the next leg up.
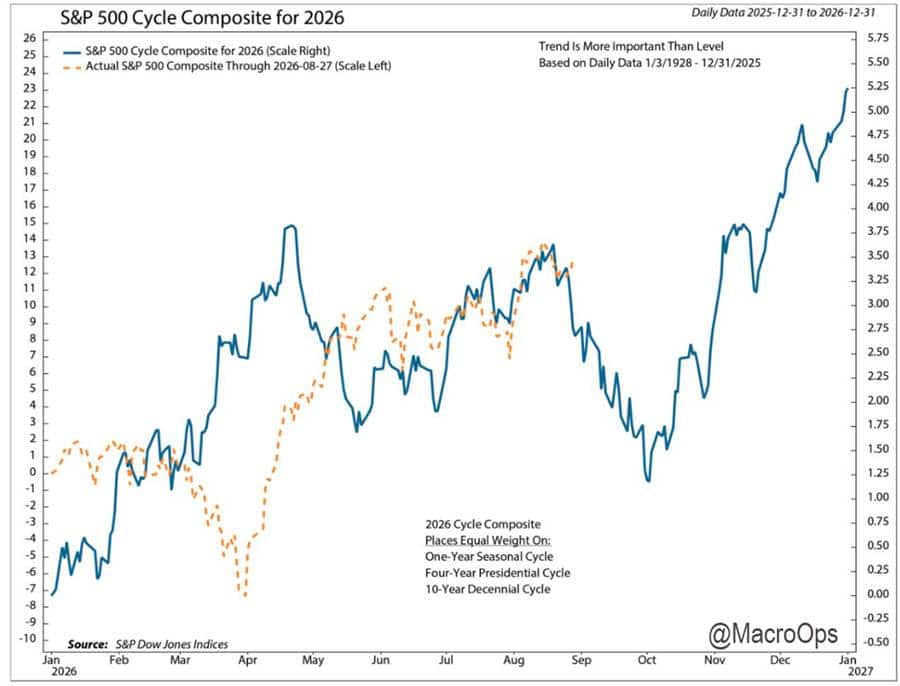
5. This aligns with the cycle composite for the SPX, where seasonality is quite bearish over the next month. The market, of course, doesn’t have to follow this pattern, and while I don’t expect a severe selloff, the rest of the data is telling me that we should expect some downside over the next few weeks.
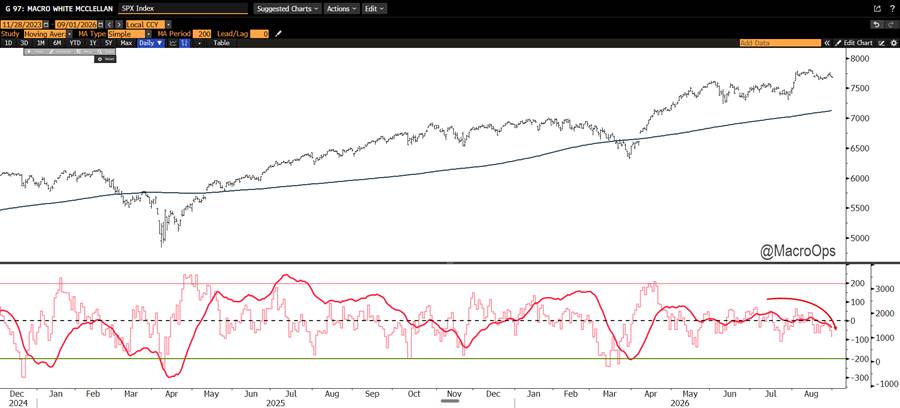
6. Our preferred short-term measures of breadth momentum are the McClellan Oscillator and Summation indices below in red. Both are currently rolling over.
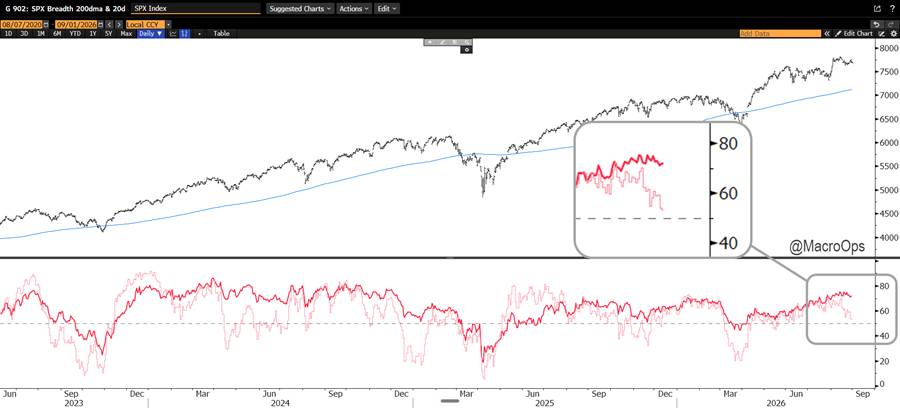
7. Which is what we’re also seeing in the % of members above their 200 and 50-day moving averages. Again, this isn’t the breadth profile of a terminally ill market. Just one that is losing some steam and likely needs a small flush to build up energy for the next leg higher.
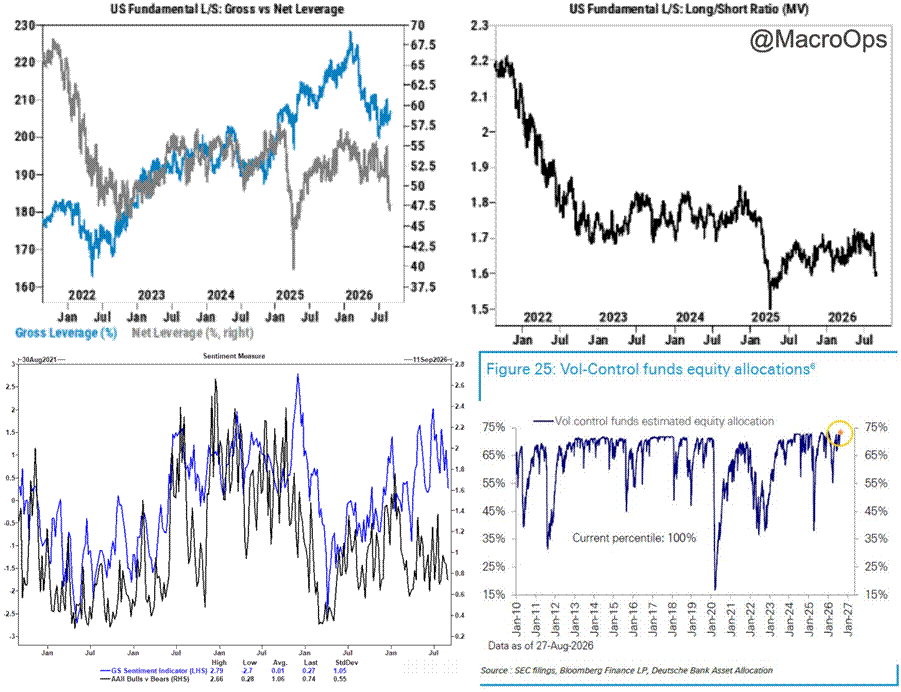
8. Some highlights from the latest prime broker sentiment and positioning reports from GS and DB:
Defensive shift: Hedge funds moved to the fastest U.S.-equity net selling since Liberation Day, taking net leverage to a one-year low; selling hit tech, cyclicals, utilities, and real estate.
Systematic positioning is still stretched: DB puts it at the 82nd percentile since 2010, with vol-control exposure at a 100th-percentile historical maximum—limiting further buying and raising downside flow risk if volatility rises.
Calm index, fragile internals: SPX/VIX remains contained, but high-beta momentum and TMT/AI baskets have sold off sharply, exposing crowding and factor-volatility risk.
Overall, the picture is pretty mixed, positioning-wise. Q3 buyback blackout window begins on 9/15 for roughly 40% of the SPX’s market cap, pulling an important layer of support for this market during its worst two-week period of the year, according to GS.
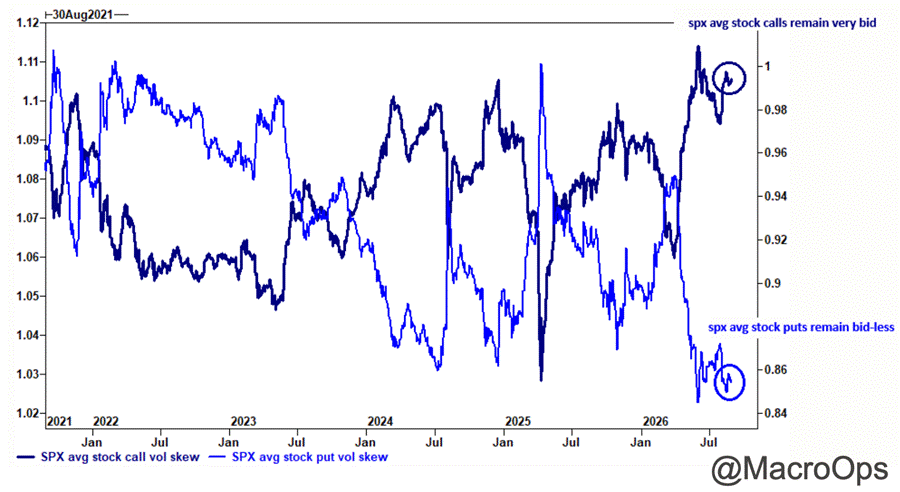
9. But SPX call/puts suggest some complacency.
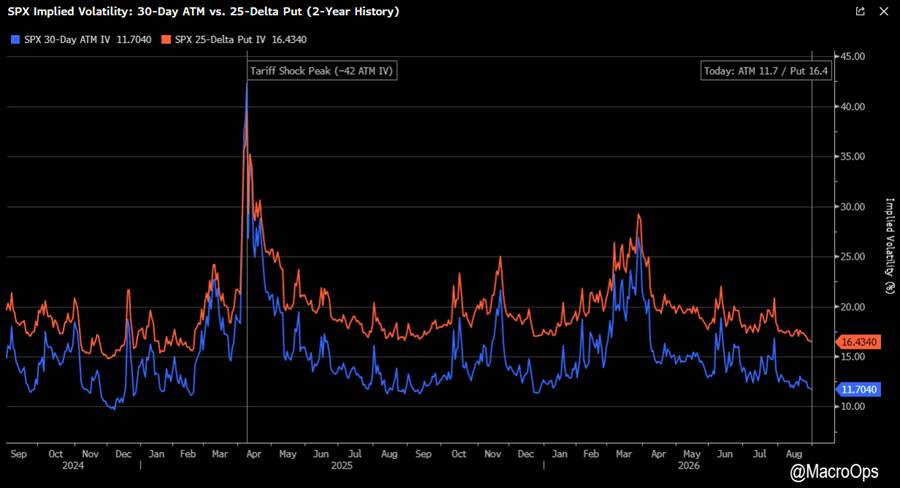
10. SPX 30-Day ATM IV at 11.7 is near the lowest levels of the past two years — only the Dec 2024 low vol period was cheaper, briefly touching ~9.7. So not a bad time to buy a little protection for your long book.
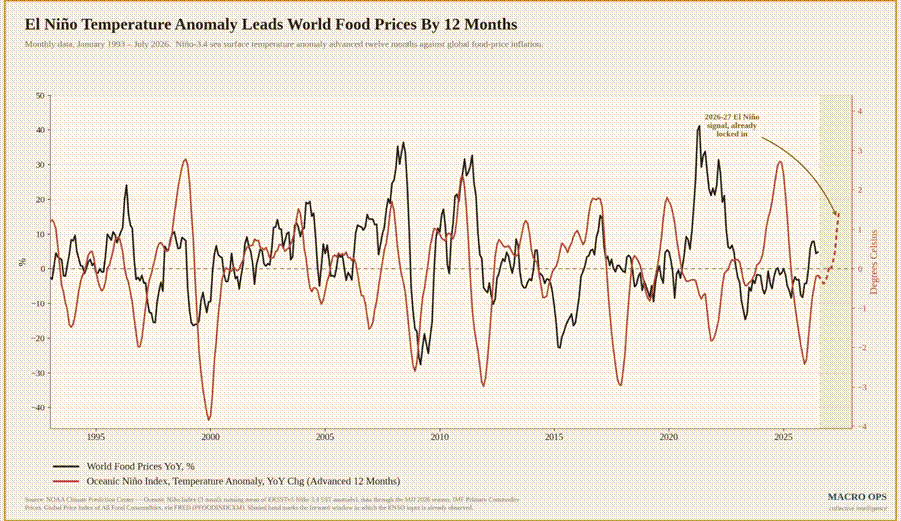
11. We remain primarily focused on the Ags trade. The El Niño temperature-anomaly index (red line) has historically led global food prices by roughly 12 months, and it is now accelerating sharply (h/t Variant Perception). The second chart shows that this El Niño is arriving faster than almost any prior event on record.
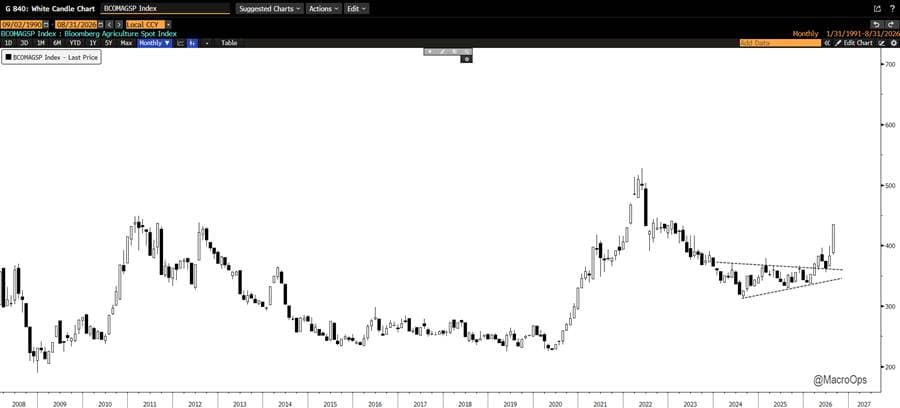
12. The BBG Agriculture Spot Index put in a large monthly bar which closed on its highs, following a breakout from a major multi-year compression regime. This is a very bullish chart.
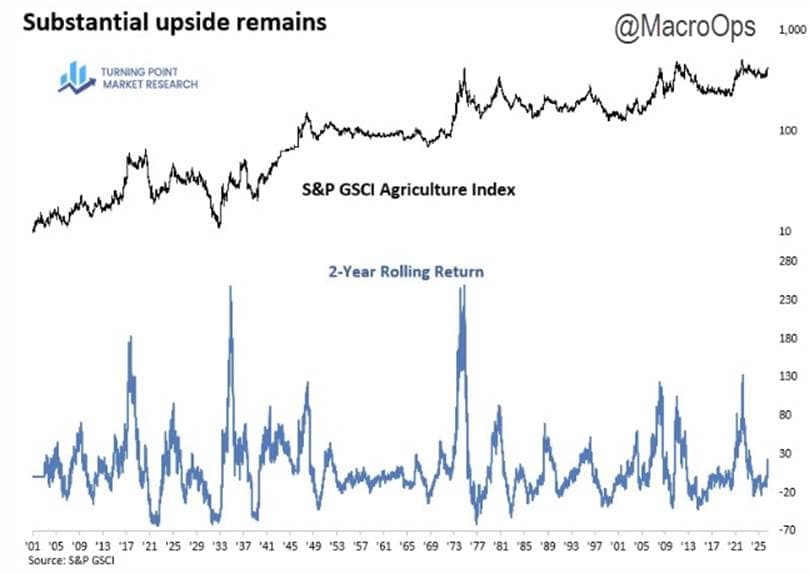
13. My teammate Dean Christians shows (link here) that when Ags get moving, they can really move. And on a 2yr rolling basis, this move has a long way to go to match previous bulls.
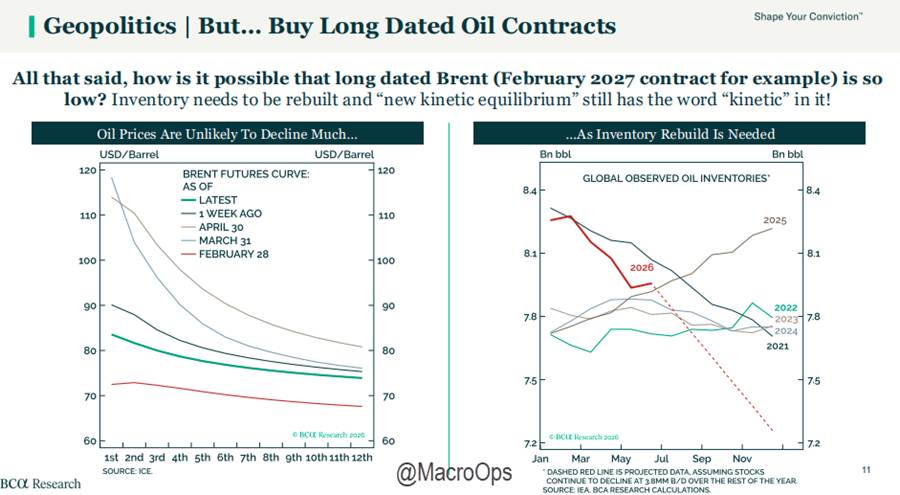
14. Someone sent me Papic’s latest slide deck, and I strongly agree with his Brent view in the slide below. Global inventories will need to be rebuilt, while Chinese crude imports have likely bottomed — removing a key headwind that has helped cap prices since the war began.
Meanwhile, the conflict appears to be entering another escalatory phase, as Iran increases its use of kinetic leverage in an effort to pressure Trump ahead of the midterms. Positioning remains heavily short, the December contract is nearing a breakout to new highs, and we are entering a seasonally strong period. And calls are cheap.
Comments
Log in or sign up to join the conversation.