

This morning's release of the October Existing-Home Sales fell to a seasonally adjusted annual rate of 5.46 million units from the previous month's revised 5.36 million. The Investing.com consensus was for 5.47 million. The latest number represents a 1.9% increase from the previous month and a 4.6% increase year-over-year.
Here is an excerpt from today's report from the National Association of Realtors.
“Historically-low interest rates, continuing job expansion, higher weekly earnings and low mortgage rates are undoubtedly contributing to these higher numbers,” said Yun. “We will likely continue to see sales climb as long as potential buyers are presented with an adequate supply of inventory.” [Full Report]
For a longer-term perspective, here is a snapshot of the data series, which comes from the National Association of Realtors. The data since January 1999 was previously available in the St. Louis Fed's FRED repository and is now only available from January 2018. It can be found here.
(Click on image to enlarge)
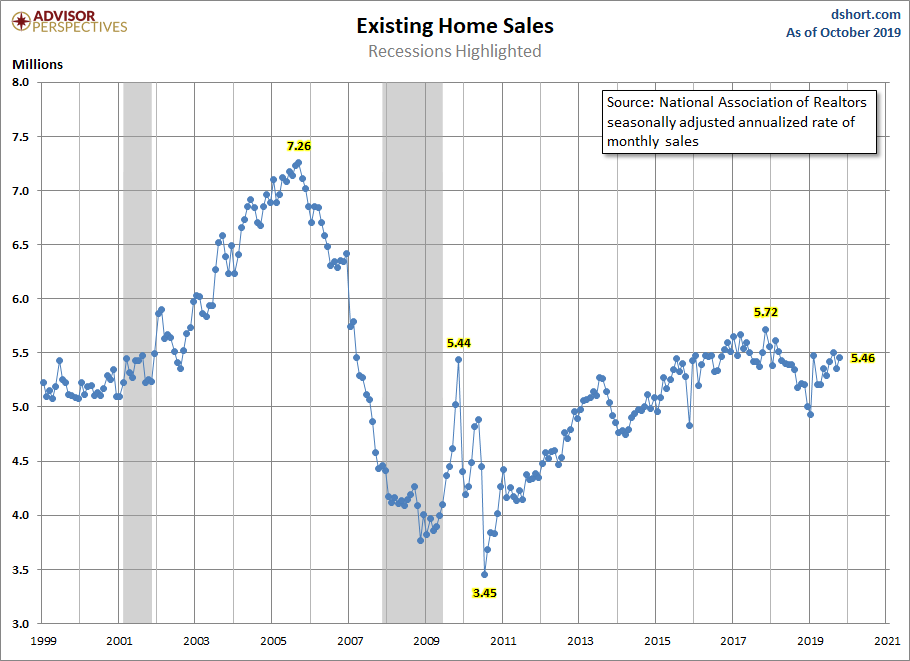
Over this time frame, we clearly see the Real Estate Bubble, which peaked in 2005 and then fell dramatically. Sales were volatile for the first year or so following the Great Recession.
The Population-Adjusted Reality
Now let's examine the data with a simple population adjustment. The Census Bureau's mid-month population estimates show an 18.8% increase in the US population since the turn of the century. The snapshot below is an overlay of the NAR's annualized estimates with a population-adjusted version.
(Click on image to enlarge)
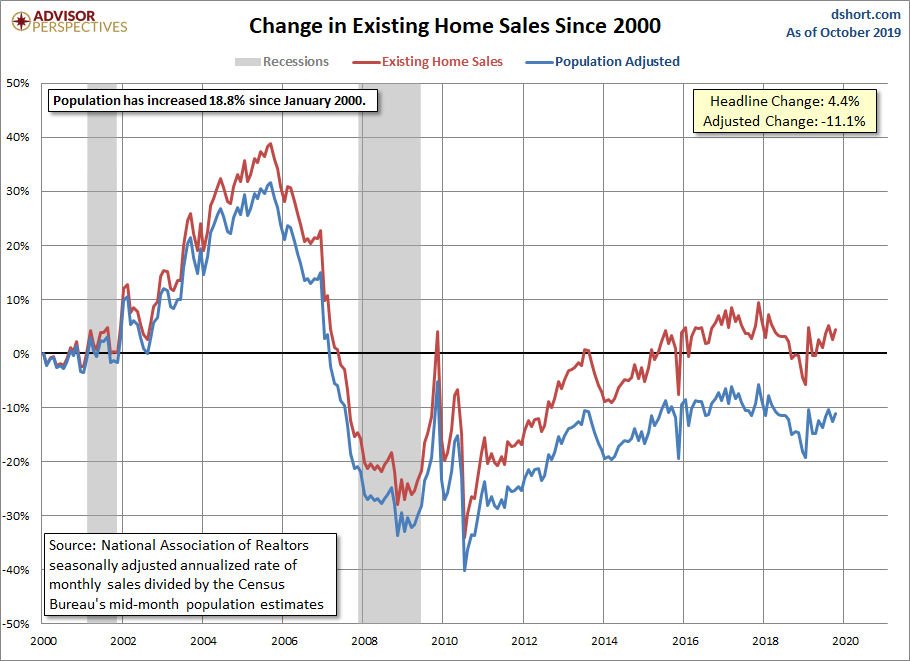
Existing-home sales are 4.4% above the NAR's January 2000 estimate. The population-adjusted version is 11.1% below the turn-of-the-century sales.
Existing-Home Sales Median Prices for Single Family Homes
We've added a chart for the last 12 months of Existing-home sales median prices for single-family homes for reference.
(Click on image to enlarge)




Comments
Log in or sign up to join the conversation.