

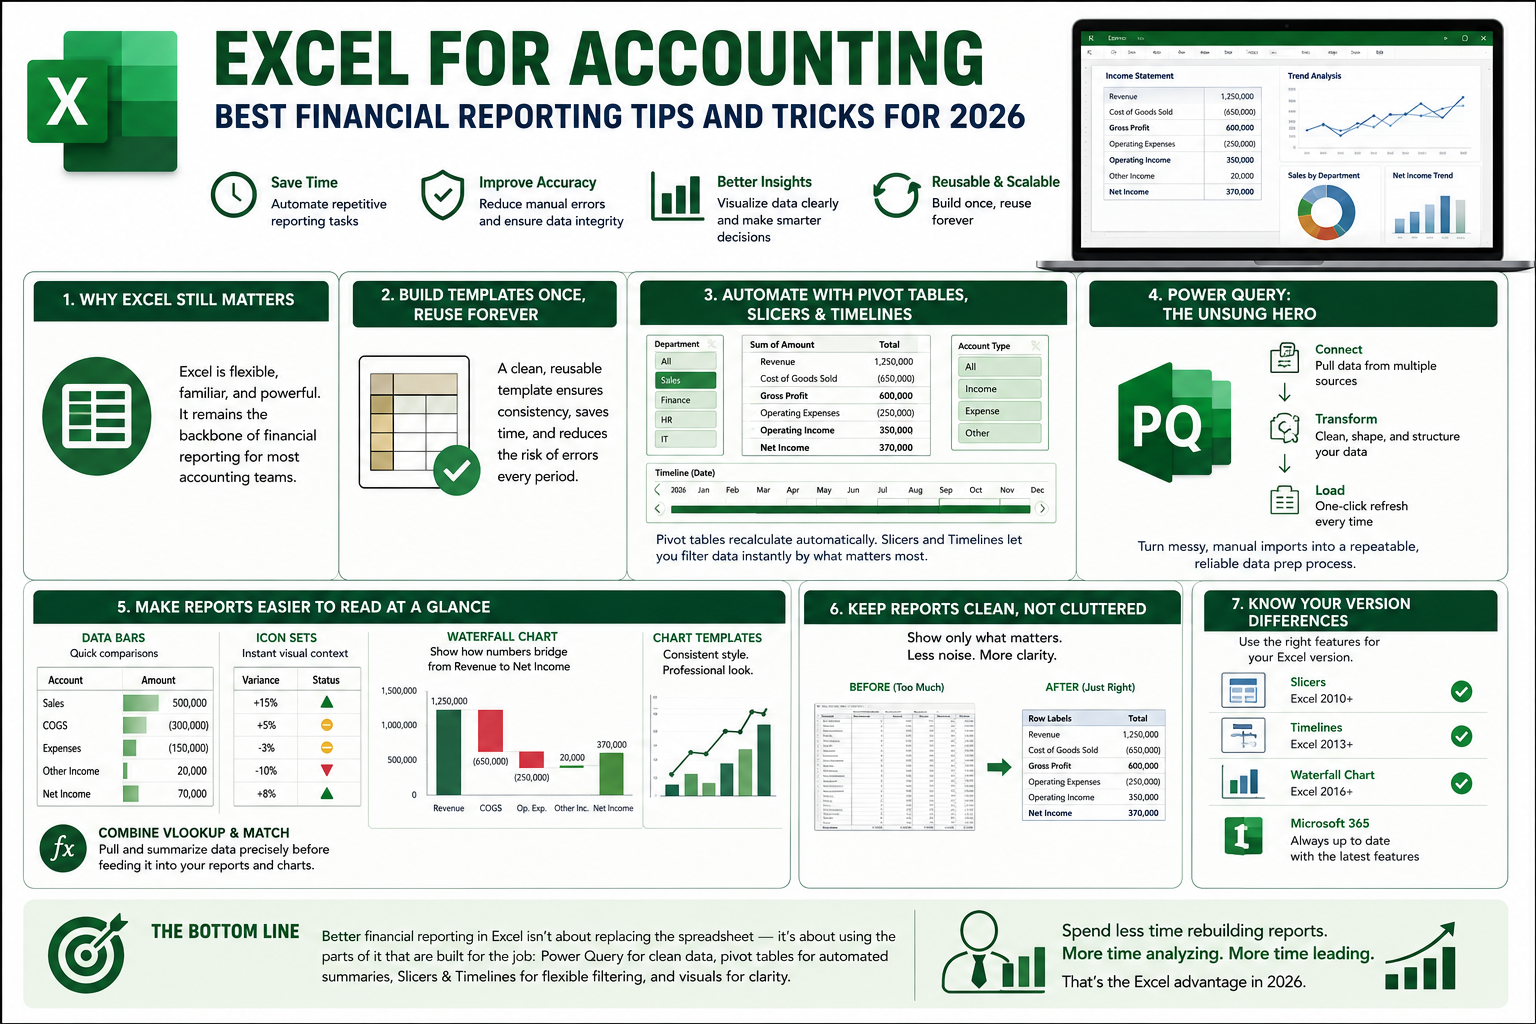
Financial reporting hasn't gotten any less demanding heading into 2026. Accountants, controllers, and finance teams are still stuck rebuilding the same reports every month, and every manual step is another chance for a formula to break or a number to get misstated. The good news is that Excel — the tool most finance teams already live in — has more than enough horsepower to fix this, if you know where to look. That's exactly the gap a recent industry webinar on financial reporting in Excel aims to close, and it offers a useful roadmap for anyone trying to modernize how they use Excel for accounting in the year ahead.
Why Excel Still Matters for Accounting Teams
Despite the rise of dedicated ERP and BI platforms, Excel remains the backbone of financial reporting for most organizations. It's flexible, familiar, and every accountant already knows the basics. The problem isn't the tool — it's how most people use it. Copy-pasting general ledger exports into static templates, manually rebuilding pivot tables each period, and reformatting charts by hand are all workflows that Excel was never meant to force on you. The techniques gaining attention for 2026 are less about learning new software and more about using Excel's existing features properly.
Build Templates Once, Reuse Them Forever
The starting point for better financial reporting is a clean, reusable template — whether that's a single worksheet or a full workbook. Instead of recreating an income statement or balance sheet layout every reporting period, a well-built template becomes the permanent shell that new data flows into. This alone eliminates a huge amount of repetitive setup work and reduces the risk that a stray formula gets overwritten or a row gets deleted by accident.
Automate Reports With Pivot Tables, Slicers, and Timelines
One of the more powerful shifts in modern Excel for accounting work is generating financial statements directly from general ledger data using pivot tables. Rather than manually summarizing transactions, you can build a pivot table once and have it recalculate automatically every time you swap in a new period's general ledger data. Layer on Slicers for filtering by category, department, or account type, and Timeline filters for narrowing results to specific date ranges, and you get a reporting engine that refreshes itself instead of one you rebuild from scratch. This is arguably the single biggest time-saver for month-end and quarter-end close.
Power Query: The Unsung Hero of Data Prep
Before any of that reporting magic can happen, data has to get into Excel cleanly. Power Query is built for exactly that — pulling data from text files, accounting systems, and other sources, then transforming and loading it into a structured format Excel can use. For teams still manually cleaning up exports before they can even start analysis, this is often the highest-leverage skill to learn. It turns a messy, error-prone import process into a repeatable, one-click refresh.
Make Reports Easier to Read at a Glance
Numbers alone don't tell a story quickly enough for executives skimming a report. A few formatting techniques go a long way:
Data Bars turn plain number lists into instantly scannable visual comparisons.
Icon Sets add visual context — think red/yellow/green indicators — to flag variances or performance thresholds without extra columns of commentary.
Waterfall charts (available in Excel 2016 and later) are particularly well-suited to visualizing how an income statement moves from revenue down to net income, showing each addition and subtraction as its own step.
Chart templates ensure every report uses the same consistent visual style, so stakeholders aren't relearning how to read a new chart layout every quarter.
Combining VLOOKUP and MATCH is also a practical way to summarize income statement data before feeding it into a waterfall visualization, especially when your source data isn't already in the exact shape a chart needs.
Keep Reports Clean, Not Cluttered
A common mistake in financial reporting is showing too much. Reducing pivot table output to only the rows and columns that matter keeps reports focused on what decision-makers actually need, rather than burying the key figures in noise.
Know Your Version Differences
Not every technique works the same way across Excel versions. Microsoft 365, as a subscription product, receives frequent feature updates, while perpetual versions like Excel 2021, 2019, 2016, and 2013 have fixed capabilities that don't change after installation. Slicers, for instance, require at least Excel 2010, Timelines need Excel 2013, and Waterfall charts aren't available before Excel 2016. Knowing which version your organization runs can save hours of frustration when a technique doesn't behave as expected.
The Bottom Line
Better financial reporting in Excel isn't about replacing the spreadsheet — it's about using the parts of it that are built for exactly this job: Power Query for clean data, pivot tables for automated summaries, Slicers and Timelines for flexible filtering, and conditional formatting or charts for clarity. For accounting professionals looking to spend less time rebuilding reports and more time analyzing them, mastering these Excel for accounting techniques is one of the most practical upgrades available heading into 2026.
FAQs
1. Is Excel still relevant for financial reporting in 2026, or should accounting teams move to dedicated software?
Yes — Excel remains the backbone of financial reporting for most finance teams because of its flexibility and familiarity. The key isn't replacing it, but using features like Power Query and pivot tables to automate the manual work.
2. What's the fastest way to cut down time spent on month-end reporting in Excel?
Building financial statements directly from general ledger data using pivot tables, rather than manually recreating them each period. Add Slicers and Timelines for quick filtering, and the report updates itself each time you refresh the data.
3. Do I need Power Query to clean up accounting data before reporting on it?
It's the most efficient way to do it. Power Query pulls data from various sources and transforms it into a clean, structured format, turning a repetitive manual cleanup process into a one-click refresh.
4. Do all these Excel reporting features work in every version of Excel?
No. Feature availability depends on your version — Slicers need Excel 2010+, Timelines need Excel 2013+, and Waterfall charts require Excel 2016+. Microsoft 365 gets continuous updates, while perpetual versions (2013–2021) stay fixed at whatever they shipped with.
Comments
Log in or sign up to join the conversation.