

Looking at the previous week we see that the price has done almost all what was expected in these analyses. Price has broken down from the range and touched the daily support line at 1.07825.
From the daily support line, price retraced back to the range resistance line and from there breaks down the daily support line and touched the next support at 1.07356.
As I pointed on Friday, many traders have to get out from the market and cash out what they have earned. Bearish strength was overtaken by the buyers just because sell orders have closed. This is a common scenario where traders do not want to hold positions over the weekend because bad news could hit the market and when the market opens on Monday, the gap that could appear could bring them big losses.
EUR/USD Daily Outlook
What I see on the daily time frame is that we have two strong bearish candles that pushed the price from the range. The second candle has closed below previous candles close at the support level at 1.07825.
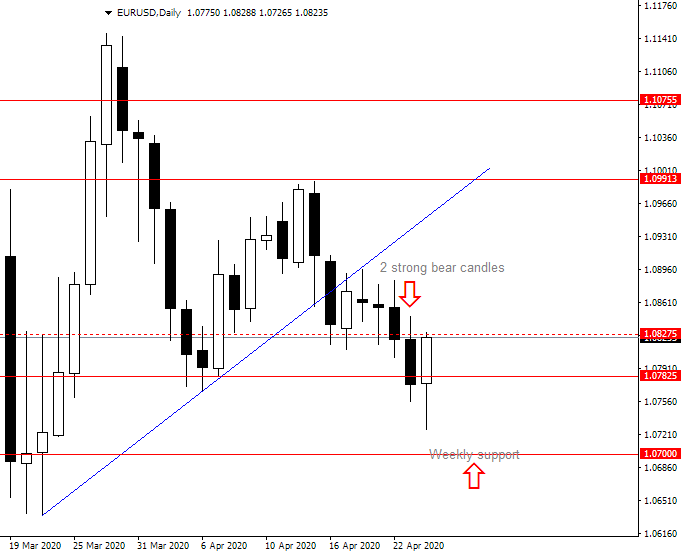
This tells us that the bears are strong and they have managed to break the support line. They will try again to break completely down to 1.07000 which is the weekly support line. There we could see a strong reversal because many sellers will close their position to cash out and many buyers will jump in to defend the support line.
The Friday bullish candle is strong but the strength could be because it was Friday and that is why the candle does not have so much influence in this analysis. Monday will show much better what is the market status and that is what is important at this point.
Weekly Forecast
We can expect on Monday that the price defines where it will go in the rest of the week. If the price bounces from the resistance line at 1.08275 the next level will be 1.07825. From there we need to see what will happen.
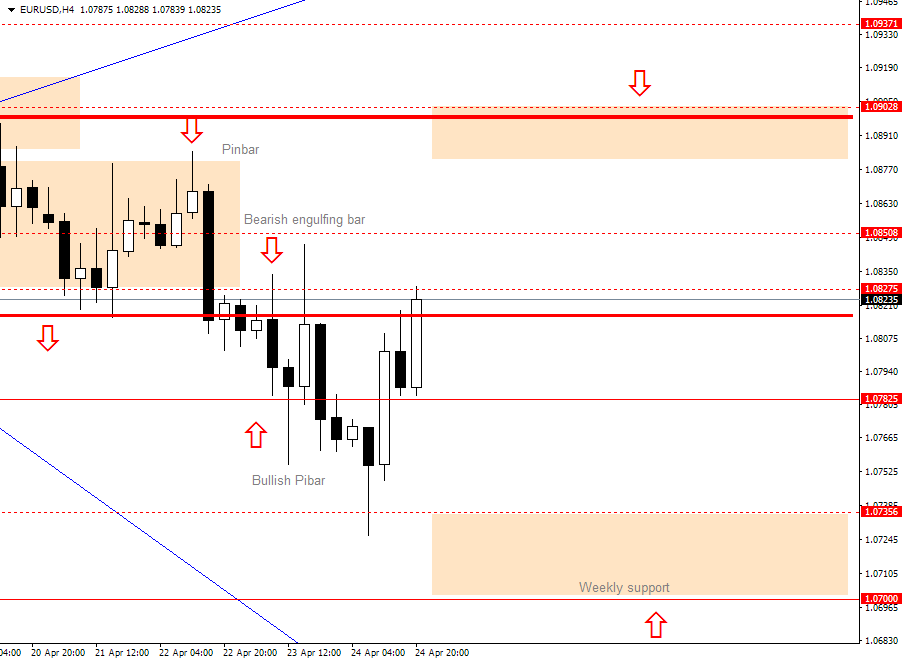
If the price closes below 1.07825 on a daily basis the price will make a move to the weekly support line at 1.07000.
Drawing the support line on a weekly time frame is done by looking on the previous support and resistance lines. What we can see is that the previous support was around 1.07000 which makes this level a very strong level.
In a bullish scenario we could see price moving up into the previous week's range and trying to hit the resistance level at 1.09028. That is the previous confluence level which acted as a strong resistance and where the sellers are waiting to push the price back down.



Comments
Log in or sign up to join the conversation.