

EUR/USD
4 hour
(Click on image to enlarge)

The EUR/USD downtrend is taking a long pause near major support levels (green) from the daily-weekly charts. A break above the resistance trendline (orange) could start a wave 2 (green) correction whereas a break below the minor support (blue) see a small fall to test the higher time frame support (greens).
1 hour
(Click on image to enlarge)
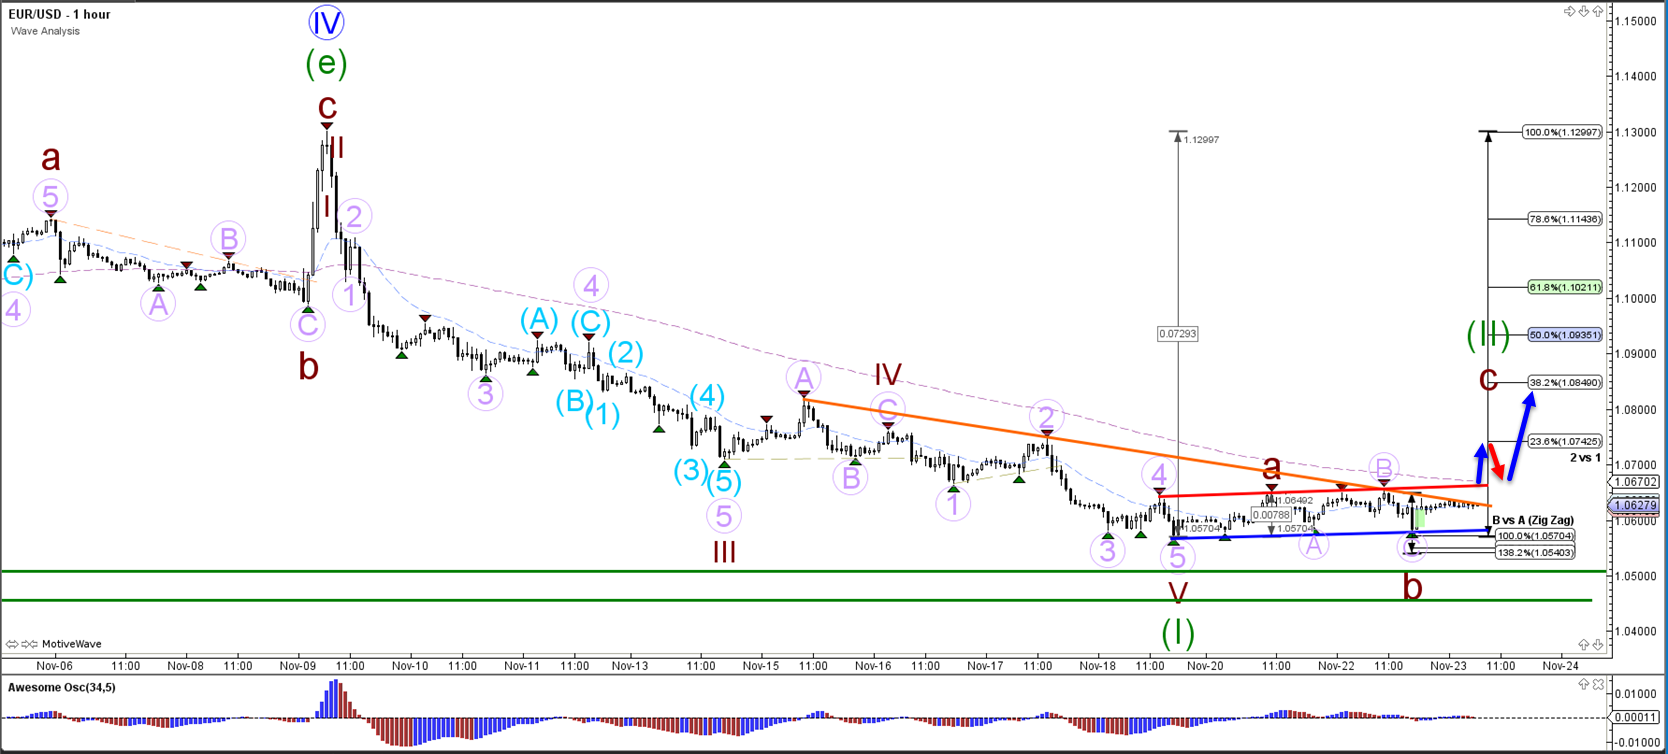
The EUR/USD continues to build a bear flag chart pattern (red/green). A bearish break could see price test the 1.05 support zone. A bullish break above resistance (orange) could indicate the completion of wave 1 (green) and continuation of wave 2 (green) correction.
GBP/USD
4 hour
(Click on image to enlarge)
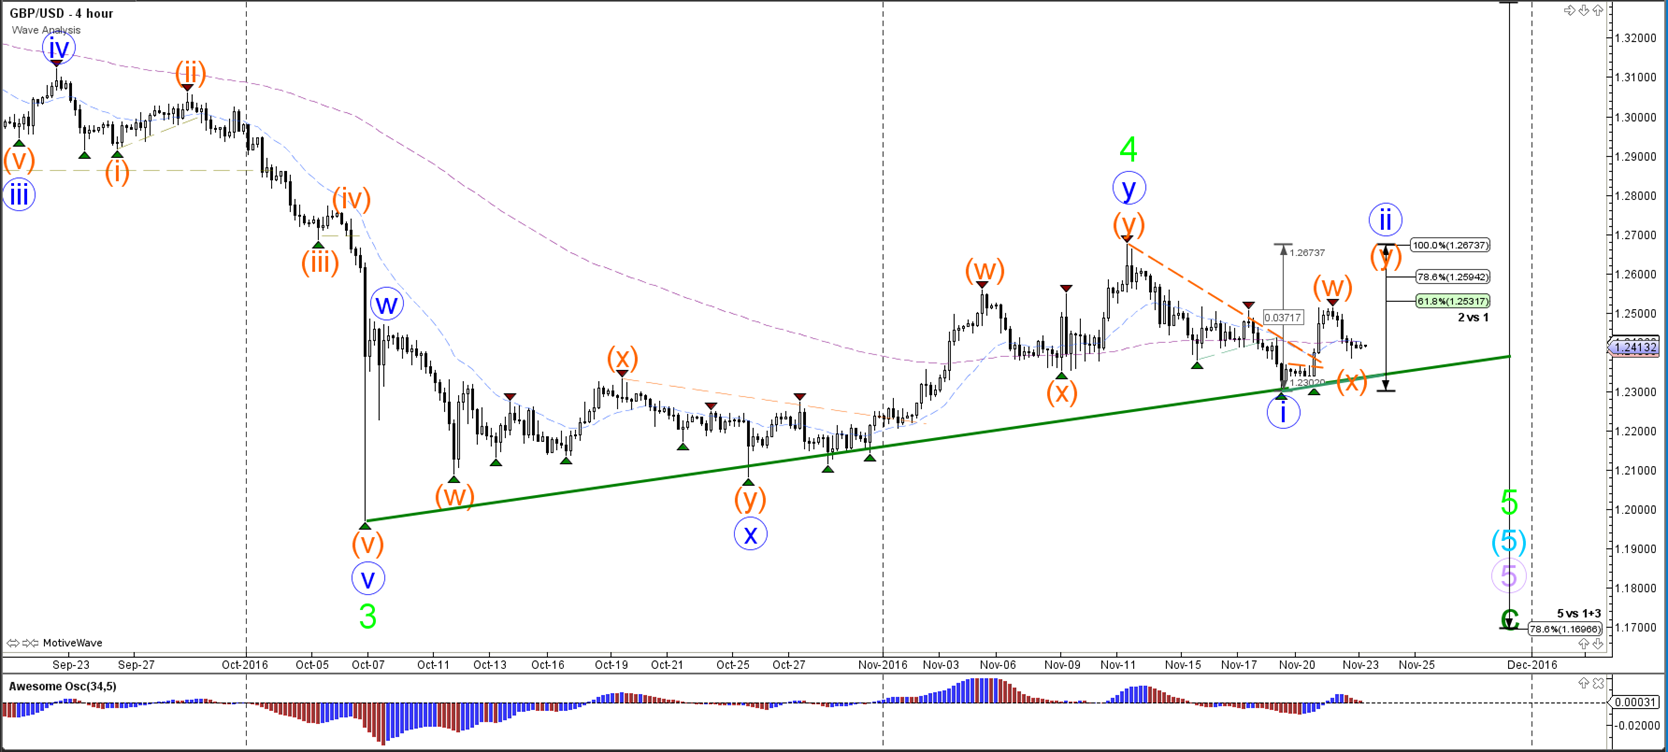
The GBP/USD needs to break below the support trend line (green) before the wave 2 (blue) is completed. At the moment an extended wave 2 (blue) could occur via a WXY (orange) correction.
1 hour
(Click on image to enlarge)
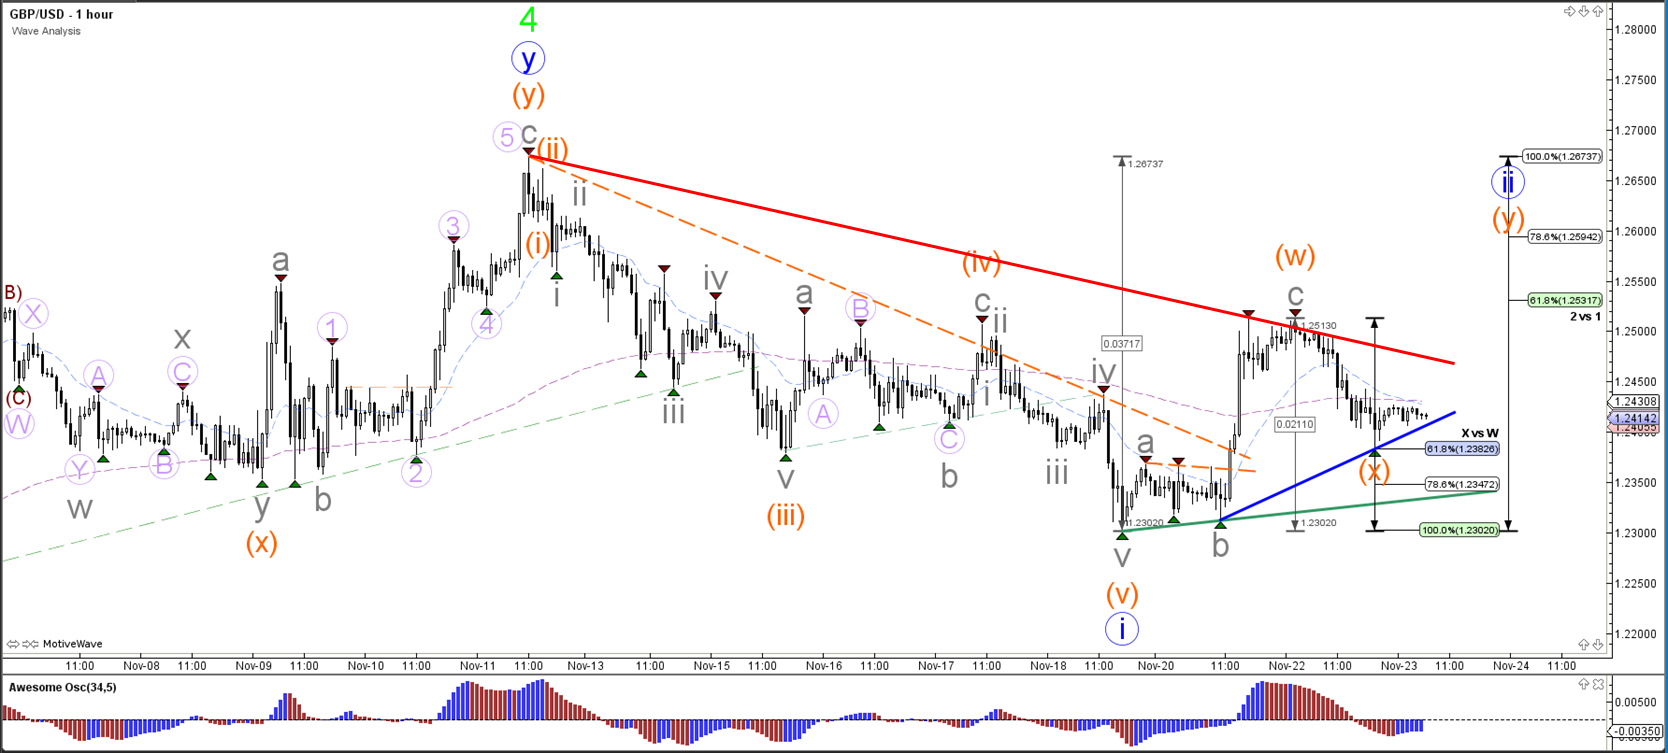
The GBP/USD completed an ABC (gray) zigzag at the 61.8% Fibonacci level of wave 2 (blue). Price could complete the wave 2 at Fibonacci retracement levels although a break above the 100% level invalidates the current wave count. If the price is not building an expanded correction (WXY orange), then the price will break through the Fibonacci support and trend lines (blue/green).
USD/JPY
4 hour
(Click on image to enlarge)

The USD/JPY bullish momentum slows down which could indicate that a wave 3 (blue) is near completion. It also means that a wave 4 (blue) retracement could start when the price is able to break below the support trend line (green).
1 hour
(Click on image to enlarge)
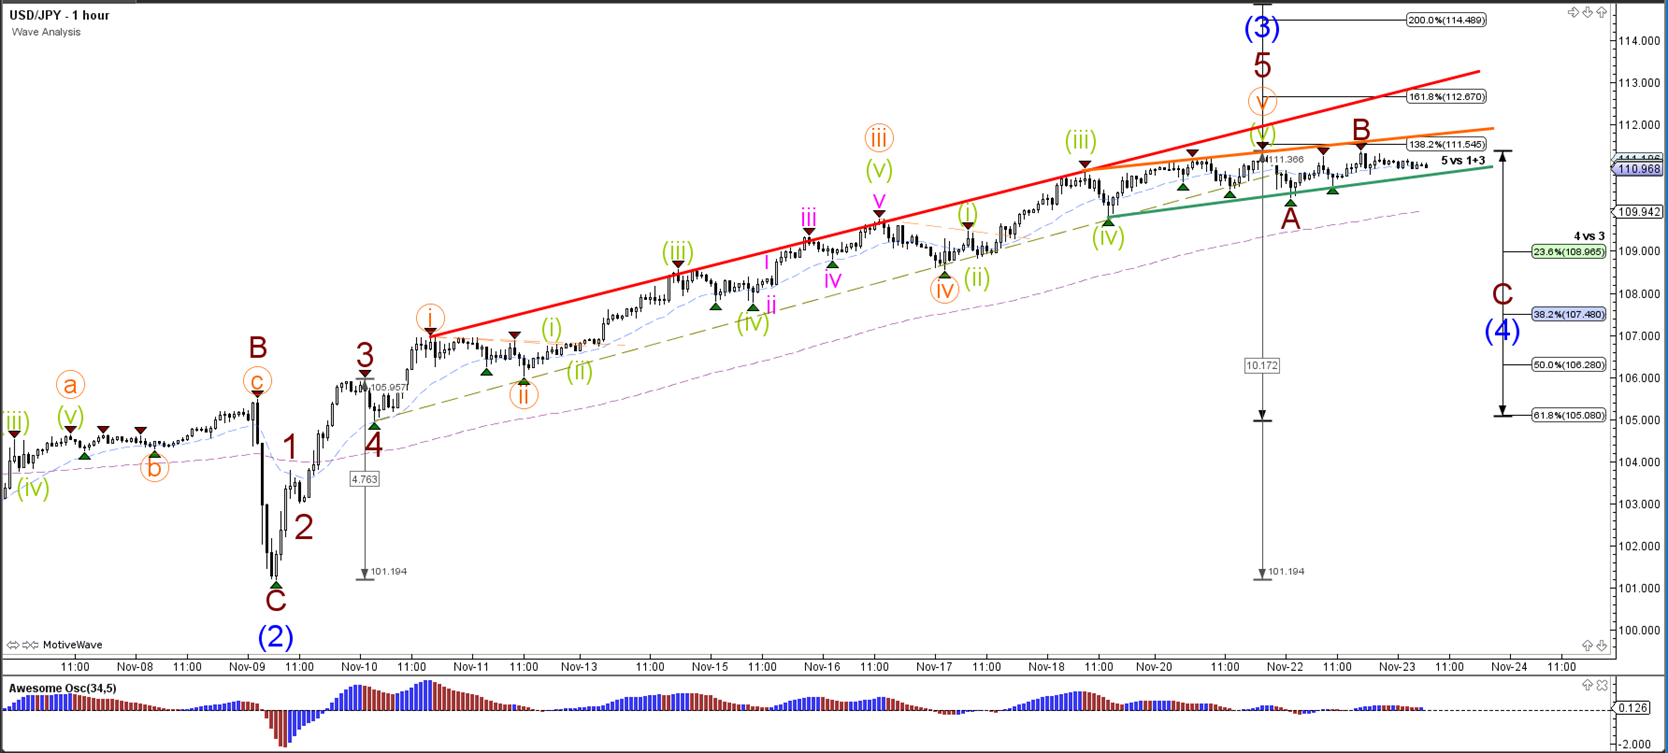
The USD/JPY could be ready to build an ABC (brown) zigzag correction within wave 4 (blue) unless price breaks above resistance (orange).



Comments
Log in or sign up to join the conversation.