

EUR/USD
4 hour
(Click on image to enlarge)

The EUR/USD downtrend continues lower after making a retracement and breaking support (dotted green). A bearish 123 (purple) becomes more likely when price is able to break below the 161.8% Fibonacci target.
1 hour
(Click on image to enlarge)

The EUR/USD broke below the support trend line (dotted green) and is building a bearish 3rd wave (orange). Once the wave 3 is completed then a slow and gradual wave 4 correction is expected.
GBP/USD
4 hour
(Click on image to enlarge)

The GBP/USD failed to break the horizontal resistance (red). The broken resistance (dotted red) has now turned into a potential support level in the development of wave C (pink). The triangle pattern seems to be confirming the corrective mode at the moment.
1 hour
(Click on image to enlarge)
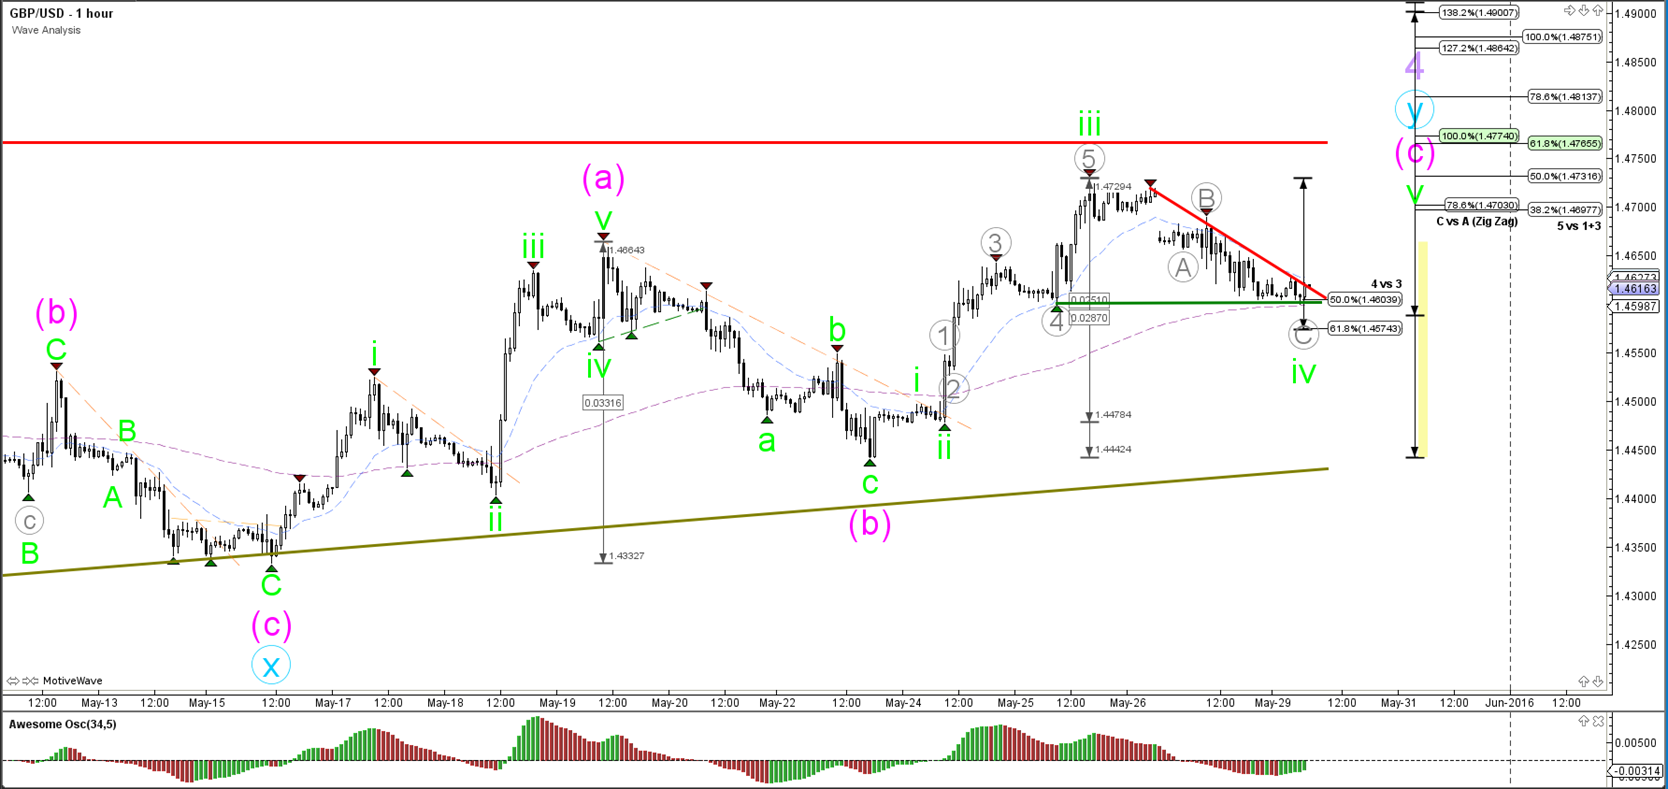
The GBP/USD seems to have made an ABC (grey) correction within the wave 4 retracement (green) as long as price stays above the 61.8% Fibonacci level. A break of the resistance trend line (red) of the triangle helps confirm the start of wave 5 (green).
USD/JPY
4 hour
(Click on image to enlarge)

The USD/JPY broke the resistance (dotted red) of the contracting triangle chart pattern. Price is now moving higher as part of the wave 5 (purple).
1 hour
(Click on image to enlarge)
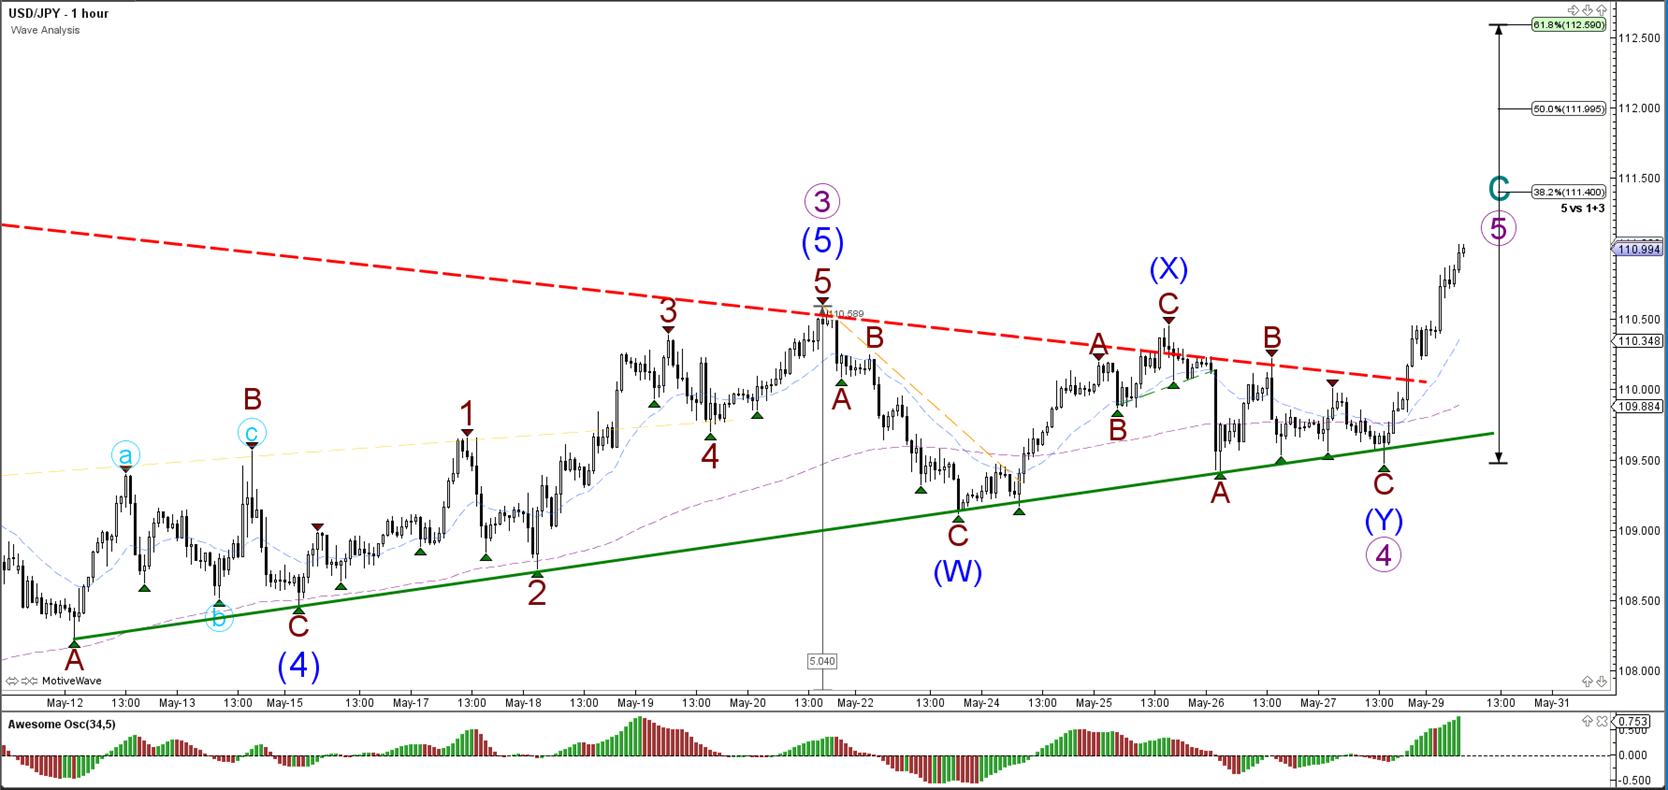
The USD/JPY broke above resistance (red) and price is now moving towards the Fibonacci targets of wave 5 (purple).



Comments
Log in or sign up to join the conversation.