


The key factor dominating markets right now is the strong drop in the American stock market. This is often correlated with a strong US Dollar, but that is not the case today, as we see the DXY (US Dollar Index) trading lower. The key question facing traders in the EUR/USD currency pair now is whether the long-term bearish trend is done, or has further to run and might again test the long-term low which is less than 100 pips away.
EUR/USD Fundamental/Sentimental Analysis
The Euro has a mixed fundamental outlook, with persistent inflation supporting restrictive ECB policy while rising energy costs threaten economic growth. The ECB held rates unchanged on 29 October following increases in June and September but warned that the worsening energy shock would keep inflation above its 2% target for several quarters, limiting room for monetary easing. Resilient services activity and government infrastructure and defence spending provide some support, although higher financing costs and weaker consumer confidence constrain the recovery.
The US Dollar has a mixed fundamental outlook, with persistent inflation keeping another Federal Reserve rate increase in play, while the Fed’s patient stance and softer short-term Treasury yields constrain its near-term appeal. The Fed held rates at 3.75%–4.00% on 28 October, although two policymakers preferred a hike, highlighting continued concern over price pressures. However, slowing wage growth and doubts about the sustainability of AI investment raise risks to consumer spending and economic momentum, potentially limiting further tightening.
We have a balanced outlook, so it makes sense that the bearish momentum is slowing, and a deep retracement or even an end to the bearish trend is beginning to look possible.
EUR/USD Technical Analysis
The price action over the past few days has become more bullish. A large hourly pin bar rejected he area close to the round number at 1.1100, which was a 17-month low, turning the price action bullish just as the New Yiork session opened that day. Since then, we saw an obvious first higher low at 1.1150, which was already notable as a key support or resistance level. We then saw a higher high rejecting a resistance level at 1.1226, and we are currently in a retracement wave from there.
This recent bullish price action suggests that traders are willing to give up on the long-term bearish trend, at least for a while, and are betting on a deeper bullish retracement with some conviction, although it is not very strong.
The key levels to watch to judge this market now will be the resistance at 1.1226 and the support levels at 1.1171 and 1.1150.
This currency pair is prone to deep retracements within trends, has historically tended to trend very reliably, and is now in a strong long-term bearish trend.
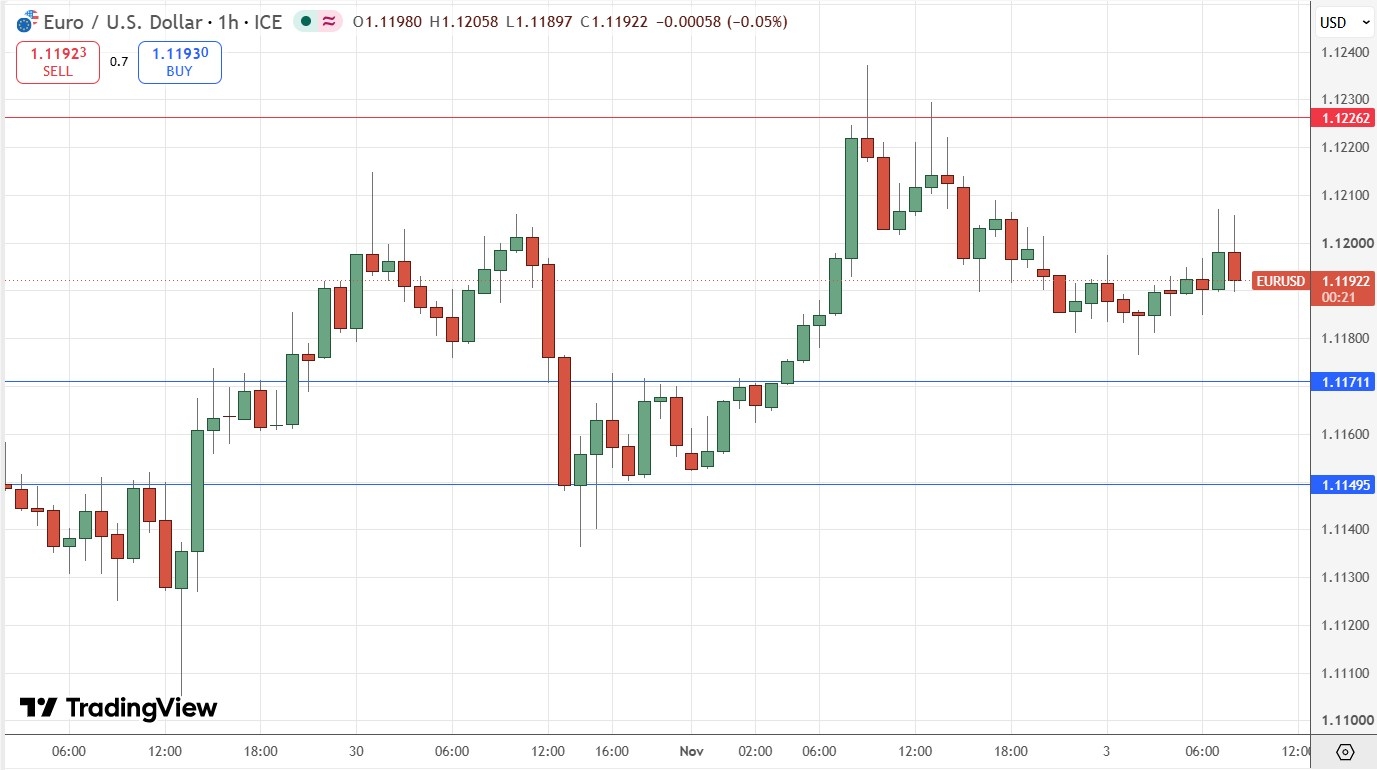
EUR/USD Price Chart – Higher Lows & Highs
My Take on EUR/USD
Short-term long trades from bounces off the support levels could work out well. I would still put more emphasis on short trades as the long-term bearish trend remains in effect below 1.1300, so a short trade from a bearish rejection of 1.1226 might be a good idea.
Review, Support & Resistance Levels
In my previous EUR/USD signal on 13th October there could have been a short trade from the bearish rejection of 1.1187, which would have been a losing trade. However I did forecast an eventual move to new lows, which did happen on subsequent days.
Risk 0.75%.
Trades may only be taken prior to 5pm London time today.
Short Trade Ideas
Short entry following a bearish price action reversal on the H1 timeframe immediately upon the next touch of $1.1226, $1.1282, or $1.1311.
Put the stop loss 1 pip above the local swing high.
Adjust the stop loss to break even once the trade is 20 pips in profit.
Remove 50% of the position as profit when the price reaches 20 pips in profit and leave the remainder of the position to ride.
Long Trade Ideas
Long entry following a bullish price action reversal on the H1 timeframe immediately upon the next touch of $1.1171 or $1.1150.
Put the stop loss 1 pip below the local swing low.
Adjust the stop loss to break even once the trade is 20 pips in profit.
Remove 50% of the position as profit when the price reaches 20 pips in profit and leave the remainder of the position to run.
The best method to identify a classic “price action reversal” is for an hourly candle to close, such as a pin bar, a doji, an outside or even just an engulfing candle with a higher close. You can exploit these levels or zones by watching the price action that occurs at the given levels.
There is nothing of high importance scheduled today concerning either the Euro or the USD.

Comments
Log in or sign up to join the conversation.