


Bullish view
Buy the EUR/USD pair and set a take-profit at 1.1350.
Add a stop-loss at 1.1150.
Timeline: 1-3 days.
Bearish view
Sell the EUR/USD pair and set a take-profit at 1.1150.
Add a stop-loss at 1.1350.
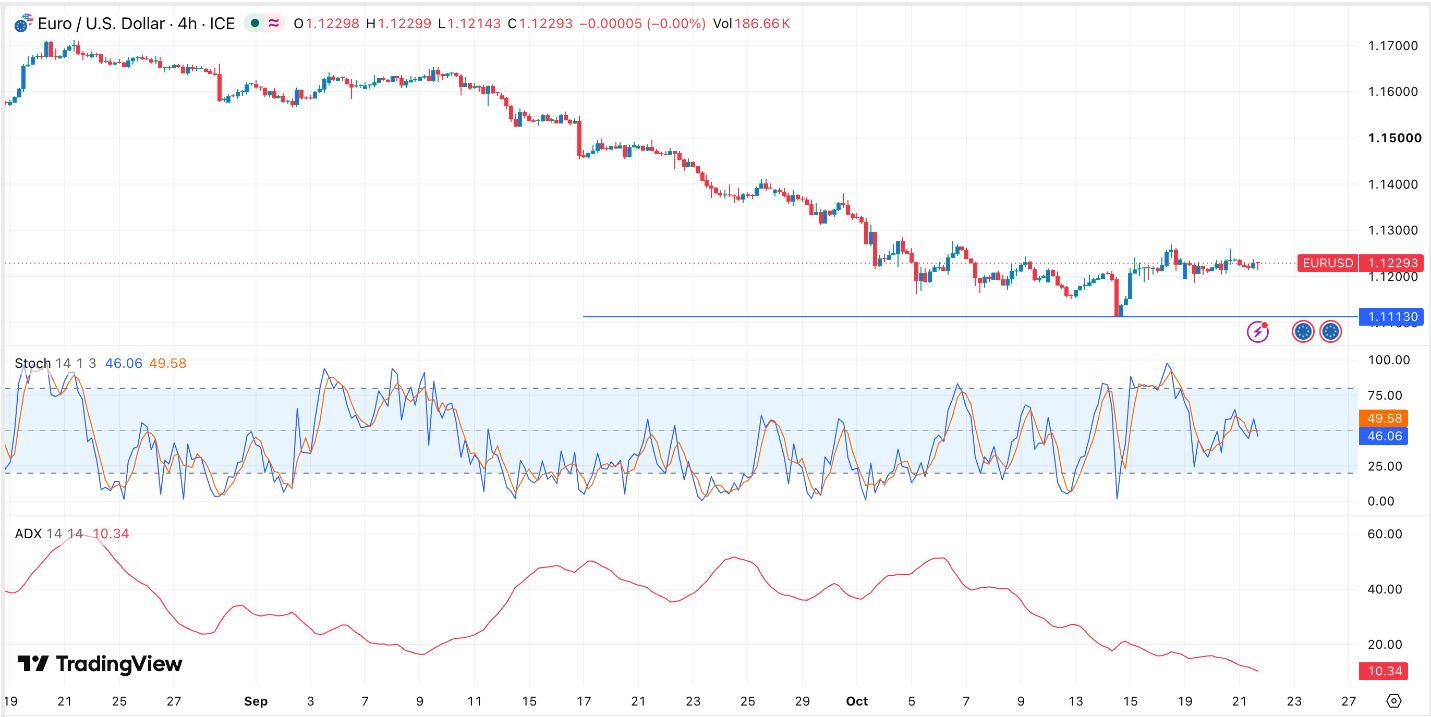
EUR/USD has wavered this week as concerns about the state of the European economy continue to weigh on market sentiment. The pair is holding near 1.1225, above this month’s low of 1.1113, as some ECB officials predict that more rate hikes will be needed.
Euro Stabilizes as France Bond Yields Jump
The EUR/USD pair remained in a narrow range as European bond yields continue rallying. Data shows that the ten-year yield jumped to a high of 5.016%, its highest level in over two decades. It has risen sharply from the year-to-date low of 3.22%.
French bond yields have risen modestly this month because of the rising public debt and the government’s efforts to reduce spending. Recently, budget cuts on the education sector have led to major protests in the country.
Other bond yields are also rising. In Italy, the ten-year yield rose to 4.60% from the year-to-date low of 3.27%. Also, in Spain, the ten-year rose to 4.09%, while in Germany, the bloc’s powerhouse, the yield has moved to 3.42%.
The rising European bond yields have led to fears that there will be another debt crisis as we saw a few years ago when Greece faced substantial risks. Now, however, the challenge is that the economies at risk are some of the biggest ones in the bloc.
The EUR/USD pair has also wavered even as some European Central Bank officials have hinted that they will support rate hikes. In a statement on Wednesday, Martins Kazakh, an ECB official said that the bloc will need to hike interest rates as inflation remains steady.
There will be no major macro data from the United States and Europe today. As such, traders will react to the developments in the energy market, where oil prices have been rising this month.
EUR/USD Technical Analysis
The four-hour chart shows that the EUR/USD pair has moved sideways in the past few days. A closer look shows that it has formed what looks like an inverted head-and-shoulders pattern, a common bullish reversal sign. It has moved slightly above the 50-periof Exponential Moving Average (EMA) and is now hovering near the neckline.
The Stochastic Oscillator has moved to the neutral level, while the Average Directional Index (ADX) has continued falling, a sign that it has no trend. Therefore, the pair will likely have a bullish breakout in the near term. If this happens, the next key target to watch will be at 1.1350.


Comments
Log in or sign up to join the conversation.