


Bearish view
Sell the EUR/USD pair and set a take-profit at 1.1325.
Add a stop-loss at 1.1450.
Timeline: 1-2 days.
Bullish view
Buy the EUR/USD pair and set a take-profit at 1.1450.
Add a stop-loss at 1.1325.
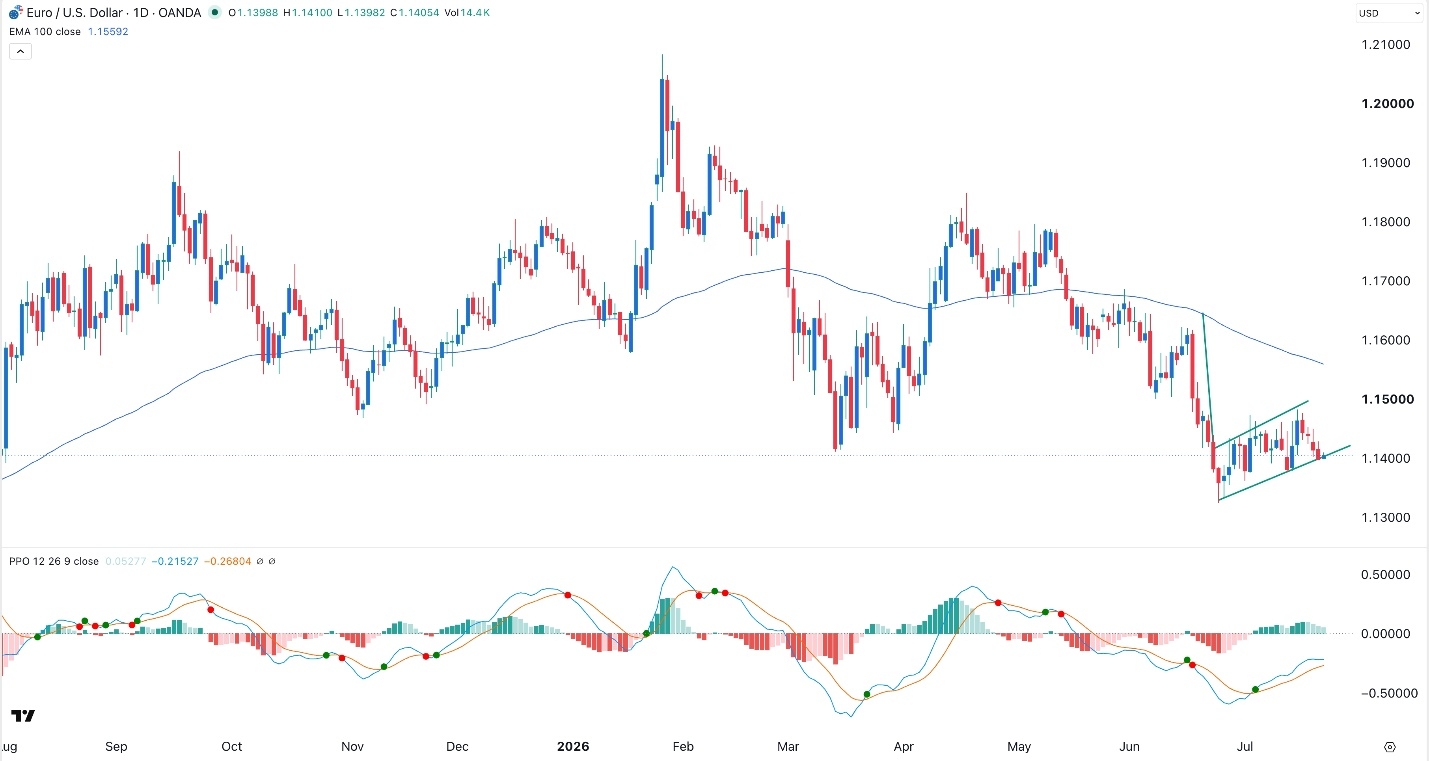
The EUR/USD pair retreated for four consecutive days as the US dollar continued rising amid the ongoing US-Iran war. It dropped to the psychological level of 1.1400, a few pips below last week’s high of 1.1482. Focus will be in the upcoming European Central Bank (ECB) decision.
European Central Bank decision
The EUR/USD pair has been in a strong downward trend in the past few days as the US dollar bounced back. This happened as the US-Iran war escalated, with the two sides launching missiles against each other.
Analysts caution that the crisis will lead to higher crude oil prices as Houthis have started a blockade of Saudi Arabian ships crossing the Red Sea. Iran may also bomb Fujairah, where millions of barrels are exported.
There is a risk that the ongoing attacks will last for weeks as Trump has continued to send jets to the region.
The EUR/USD pair also retreated as investors positioned themselves for the upcoming European Central Bank (ECB) interest rate decision. Economists expect the bank to maintain interest rates unchanged in this meeting.
However, there is a risk that the ongoing war will lead to high inflation, pushing the bank to hike rates later this year. The market is pricing in two rate hikes later this year. ING Bank analysts expect the bank to signal a hike happening in September.
There will be no major macro data from the United States today. The most important one will be data on mortgage rates and US crude oil inventory numbers.
EUR/USD Technical Analysis
The daily chart shows that the EUR/USD pair has been under pressure in the past few days. It has formed an ascending channel and is along the lower side. This channel is part of the large bearish flag pattern that has been forming since June this year.
The pair started pulling back after nearing the 50-day Exponential Moving Average. At the same time, the Relative Strength Index (RSI) has pointed downwards in this period.
Therefore, the combination of bearish moving averages and the flag pattern points to more downside. The pair will likely have a bearish breakout, potentially to the key support level of 1.1325, its lowest level in June.


Comments
Log in or sign up to join the conversation.