

The EUR/USD pair trades in positive territory around 1.1490 during the early European session on Friday, bolstered by a weaker US Dollar (USD). However, the potential upside of the major pair might be limited amid a hawkish interest rate hike by the Federal Reserve (Fed). Traders will take more cues from Fed Governor Michelle Bowman’s speech later on Friday.
The Fed decided to raise its benchmark interest rate by a quarter-percentage point to a range of 3.75% to 4%. This is the first time the Fed has raised rates since July 2023 as the central bank continues to fight to tamp down inflation.
Last week, the European Central Bank (ECB) also lifted its key deposit rate by 25 basis points (bps) to 2.50% from 2.25% in a move widely expected by investors. The ECB will wait until December before delivering a final interest-rate increase to quell inflation triggered by conflict in the Middle East, according to Bloomberg economists.
Respondents in a Bloomberg survey anticipate the Governing Council to hike the deposit rate to 2.75% at its last meeting of the year, skipping the next opportunity to do so in late October.
Eurozone inflation steadies as ECB hawkish tone keeps October hike in play
Strategists at Scotiabank note that the latest euro area inflation data did little to shift the policy narrative, with the “final euro area CPI release” offering “little in terms of surprise.” They highlight that “headline inflation [is] remaining in the low 3% area and core hovering in the mid-2% range,” levels that continue to justify a firm policy stance from the ECB. In their view, “messaging from the ECB remains hawkish,” and this is reflected in market pricing, where investors now see “just over 50% chance of a hike in October with a cumulative 36bpts of tightening by December.”
Technical Analysis: EUR/USD maintains a negative outlook below the 100-day SMA
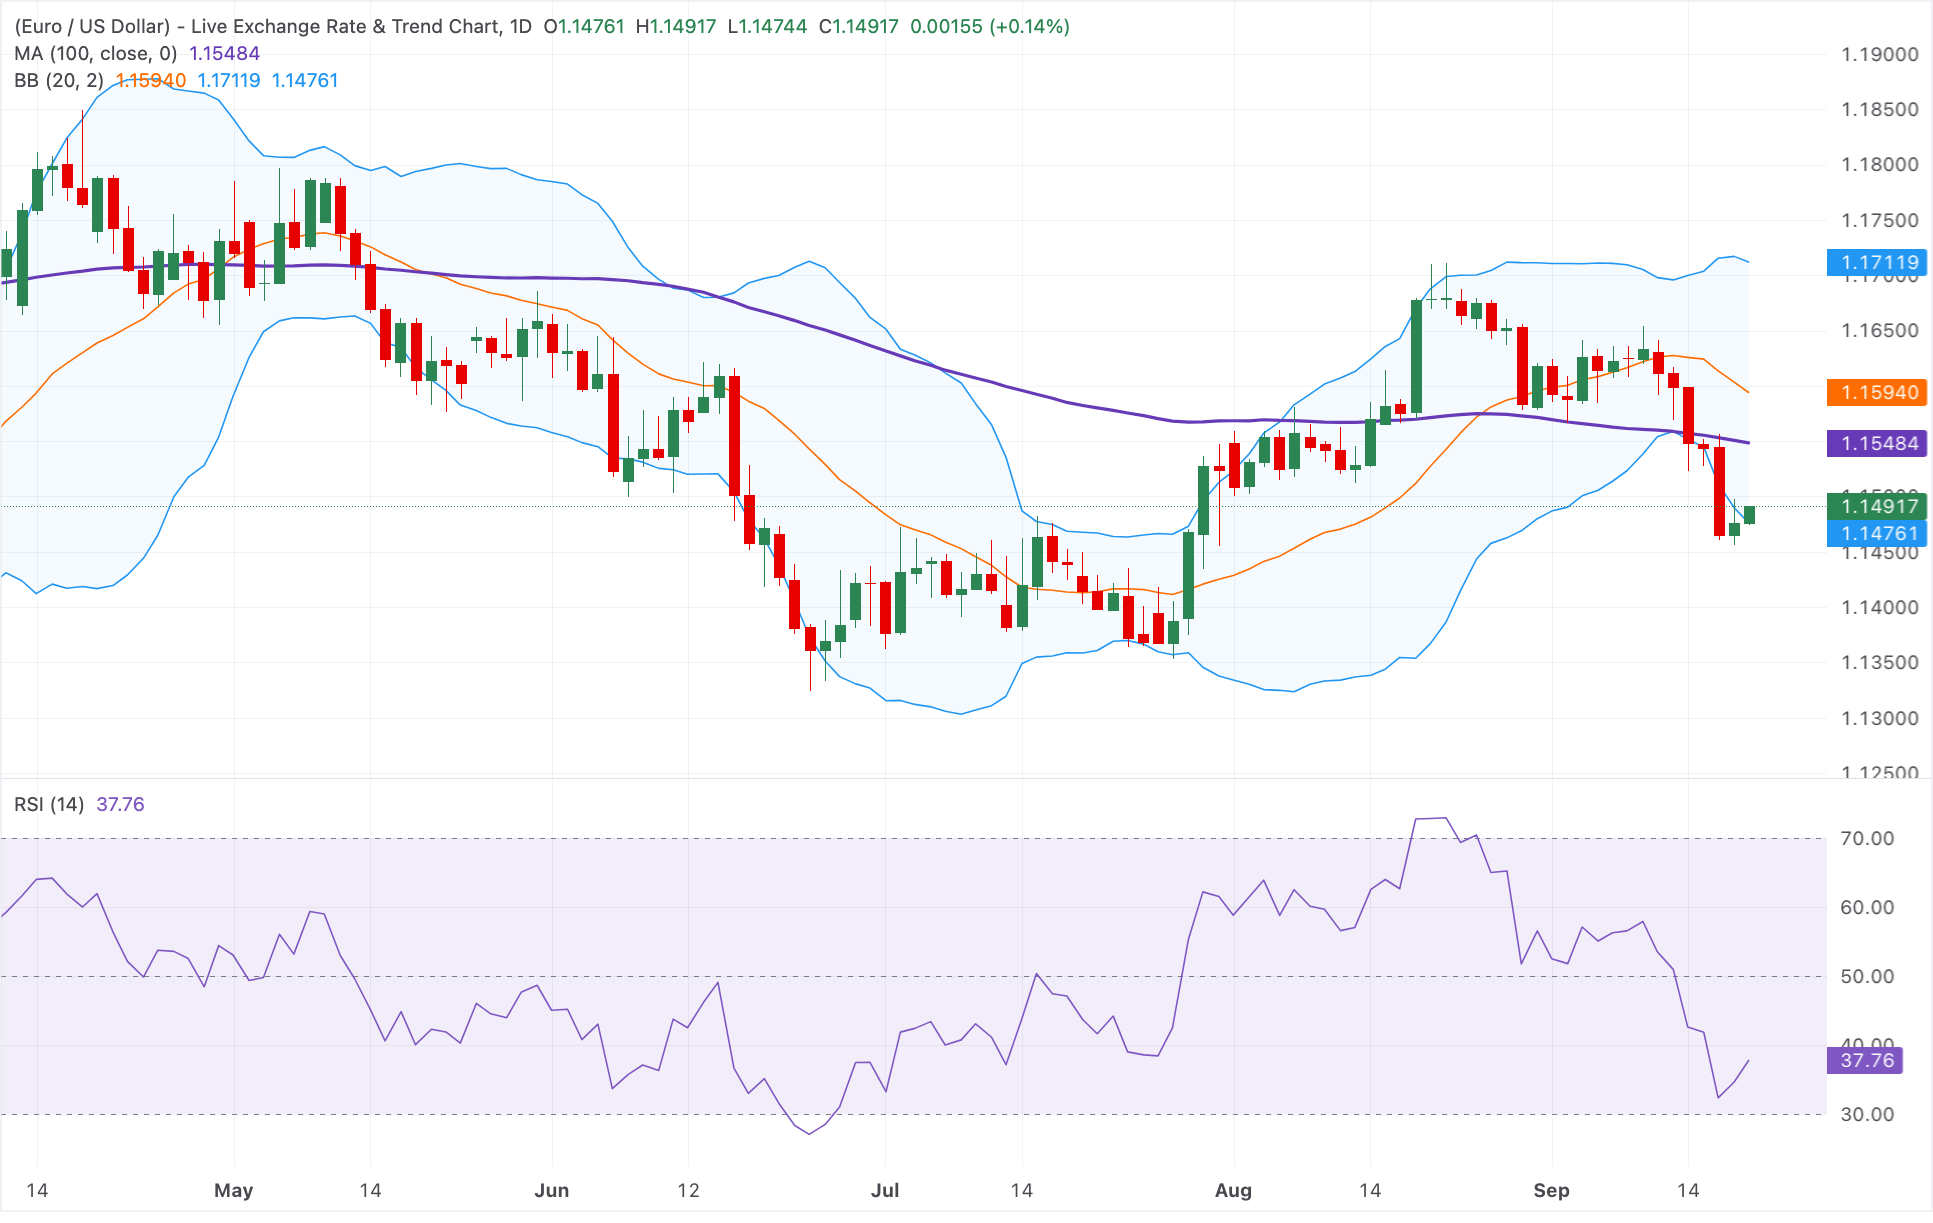
In the daily chart, EUR/USD keeps a bearish near-term tone as spot holds below the 100-day moving average and the Bollinger middle band. Price is hovering just above the lower Bollinger band, underscoring downside pressure, while the Relative Strength Index (14) around 38 hints at weak but not yet oversold momentum that could still allow further slippage before a more meaningful corrective bounce.
On the downside, immediate support emerges at the lower Bollinger band at 1.1475. A breach of the latter could expose the July 13 low of 1.1377, followed by the June 24 low of 1.1324.
On the topside, initial resistance is located at the 100-day moving average at 1.1550. Further north, the next hurdle to watch is the Bollinger middle band around 1.1595. A sustained recovery above these levels would be needed to ease the current bearish bias before the upper Bollinger band near 1.1712 comes into play.



Comments
Log in or sign up to join the conversation.