


EUR/USD struggles to extend its gains on Friday as the US Dollar (USD) steadies after coming under heavy pressure on Thursday. At the time of writing, the pair trades around 1.1230, below an intraday high of 1.1269, but remains on track for its first weekly gain in six weeks.
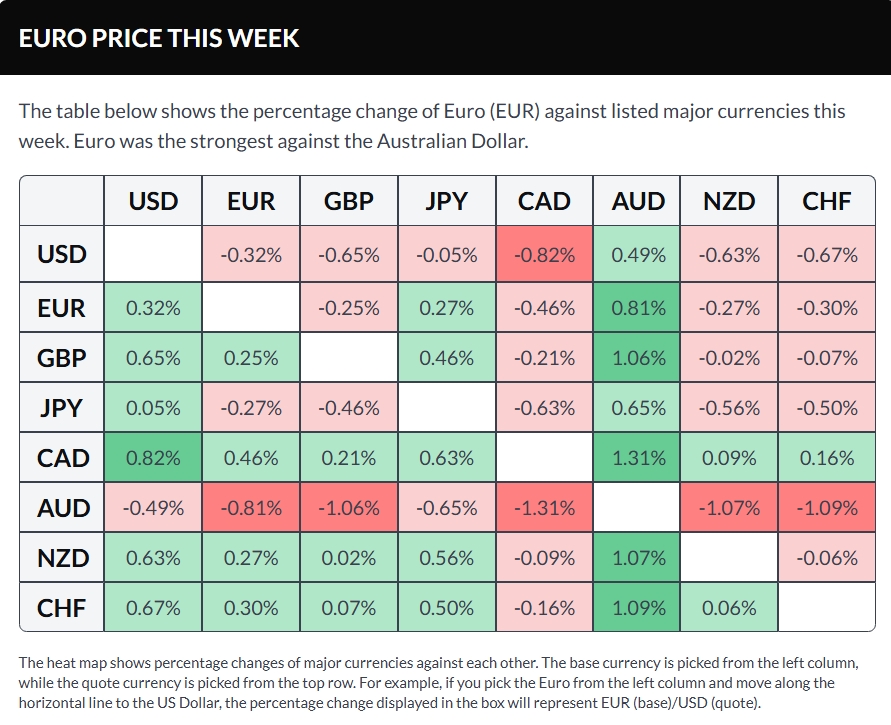
Hawkish Federal Reserve (Fed) expectations keep a floor under the US Dollar after this week’s US inflation data reinforced expectations of another rate hike before year-end. The US Dollar Index (DXY), which tracks the Greenback’s value against a basket of six major currencies, trades around 101.90 after touching an intraday low of 101.58, its lowest level since October 1.
Meanwhile, expectations of further European Central Bank (ECB) rate hikes offer limited support to the Euro (EUR), as traders weigh risks to growth alongside France’s fiscal and political concerns.
Nordea turns more constructive on USD as EUR/USD overshoots 2027 target
Strategists at Nordea highlight that "EUR/USD reached our H1 2027 target of 1.12 faster than expected." In response to the quicker-than-anticipated move, they state that "we therefore lower our year-end EUR/USD forecast to 1.10 from 1.14" and now "expect EUR/USD to test 1.08 in H1 2027 before recovering to 1.14 in H2 2027 and 1.20 by end-2028." Nordea underlines that "our baseline remains a strong US economy and two further Fed hikes, with risks skewed to the upside," and concludes that "overall, we remain constructive on the USD relative to the EUR over the next six to nine months."
Technical analysis
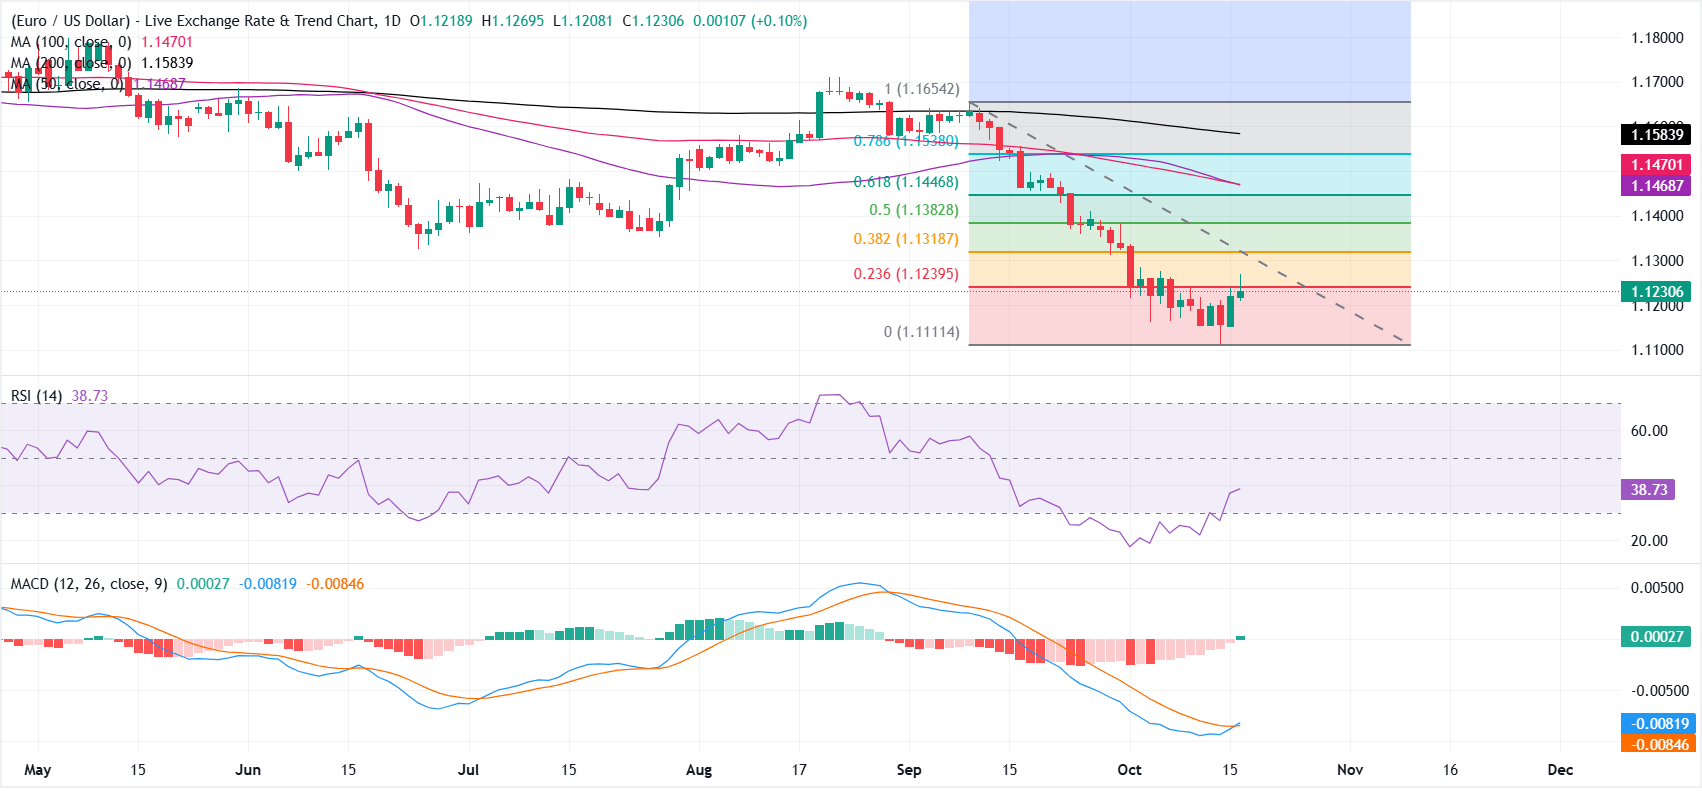
On the daily chart, EUR/USD keeps a bearish near-term bias as the pair holds well beneath the 50-day and 100-day simple moving averages (SMAs) at 1.1469 and 1.1470, and the 200-day SMA at 1.1584. Price is also below a dense Fibonacci retracement cluster, with the 23.6% level at 1.1239 leaning as immediate overhead resistance. The Relative Strength Index (RSI) at 38 suggests the pair is recovering from oversold conditions, while the Moving Average Convergence Divergence (MACD) has just turned marginally positive, hinting at waning downside momentum rather than a clear bullish shift.
On the topside, initial resistance appears at the 23.6% Fibonacci retracement at 1.1239, followed by the 38.2% level at 1.1319 and the 50% retracement at 1.1383. Higher up, the 61.8% retracement at 1.1447 is reinforced by the 50-day and 100-day SMAs clustered around 1.1470, while the 78.6% level at 1.1538 and the 200-day SMA at 1.1584 guard the path toward the cycle high at 1.1654. On the downside, the main support remains the structural Fibonacci anchor near 1.1111, where a sustained break would likely extend the broader bearish phase.



Comments
Log in or sign up to join the conversation.