

- EUR/USD drops to new multi-month lows around 1.0570.
- Extra losses could extend to the March low near 1.0515.
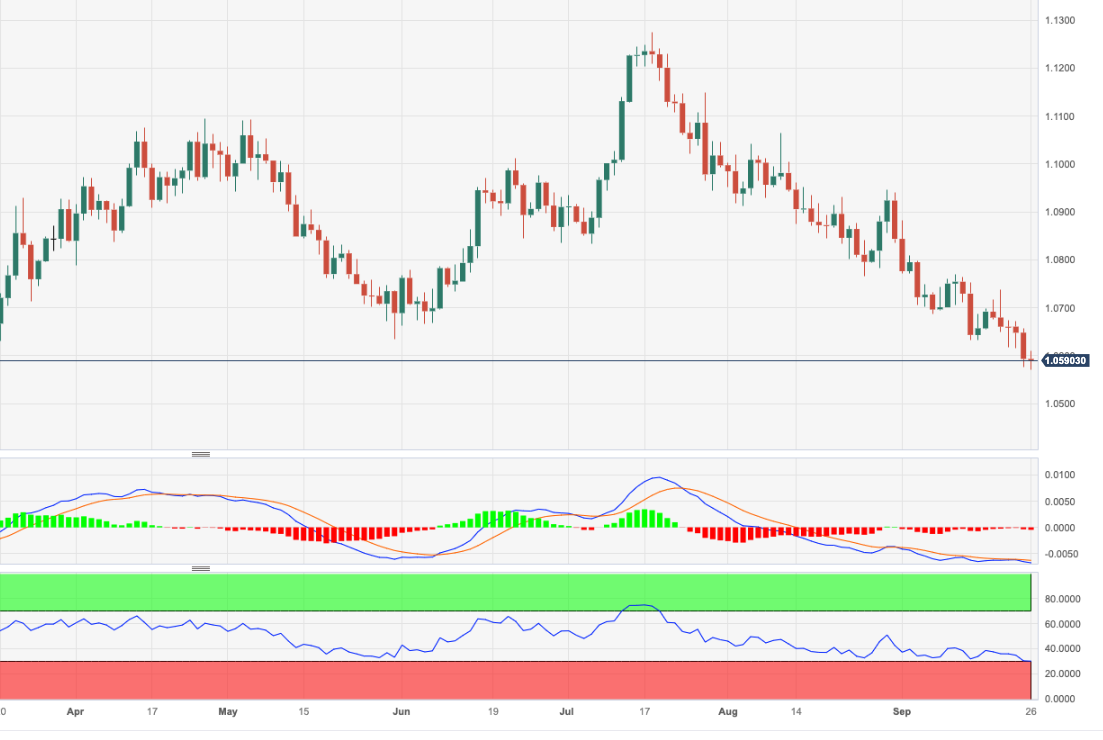
EUR/USD maintains the bearish pressure well in place and prints new six-month lows in the 1.0570/65 band on Tuesday.
If the pair breaches this level in the short-term horizon, it could then open the door to a potential retracement to the March low of 1.0516 (Mar 8), which is the last defence ahead of an assault on the 2023 low at 1.0481 (January 6).
While below the key 200-day SMA at 1.0828, the pair is likely to face extra weakness.
EUR/USD daily chart
(Click on image to enlarge)
EUR/USD
| OVERVIEW | |
|---|---|
| Today last price | 1.0594 |
| Today Daily Change | 40 |
| Today Daily Change % | 0.01 |
| Today daily open | 1.0593 |
| TRENDS | |
|---|---|
| Daily SMA20 | 1.0727 |
| Daily SMA50 | 1.0872 |
| Daily SMA100 | 1.0873 |
| Daily SMA200 | 1.083 |
| LEVELS | |
|---|---|
| Previous Daily High | 1.0656 |
| Previous Daily Low | 1.0575 |
| Previous Weekly High | 1.0737 |
| Previous Weekly Low | 1.0615 |
| Previous Monthly High | 1.1065 |
| Previous Monthly Low | 1.0766 |
| Daily Fibonacci 38.2% | 1.0606 |
| Daily Fibonacci 61.8% | 1.0625 |
| Daily Pivot Point S1 | 1.056 |
| Daily Pivot Point S2 | 1.0527 |
| Daily Pivot Point S3 | 1.0479 |
| Daily Pivot Point R1 | 1.0641 |
| Daily Pivot Point R2 | 1.0689 |
| Daily Pivot Point R3 | 1.0722 |
More By This Author:
Euro Remains Under Pressure Near The 1.0600 Region, Looks At US CalendarEUR/USD Price Analysis: Extra Losses Appear On The Table
EUR/USD Price Analysis: Further South Emerges The March Low At 1.0516


Comments
Log in or sign up to join the conversation.