

EURUSD Yesterday’s chart analysis
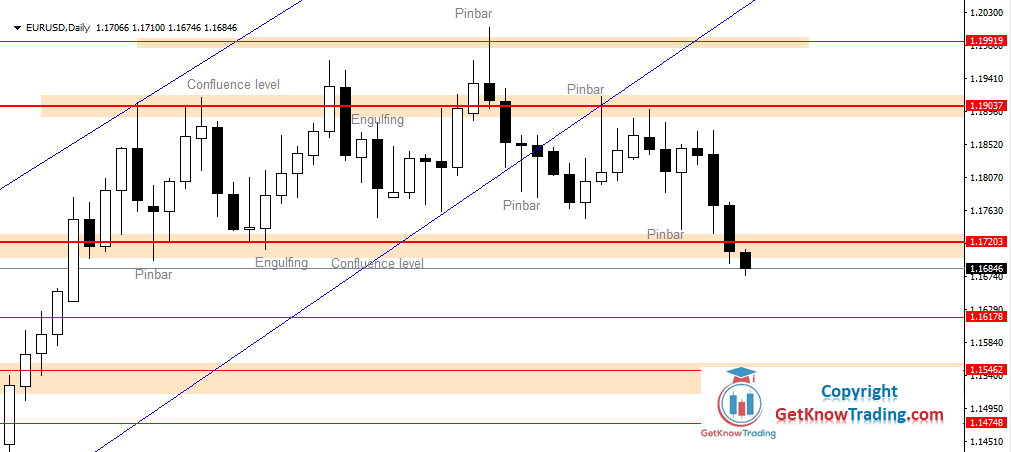
The price finally found a way outside of the range between $1.17000 and $1.19000.
The range was holding the price for almost two months. The range started at the end of July and lasted until yesterday.
Yesterday daily candle has closed below candles close of the previous days. Those candles close was a horizontal level at $1.17000 I have been waiting for.
The last two days candles were strong bearish candles that indicated the price could move down. If you take a look in the range area there were no similar strong bearish candles like these ones.
(Click on image to enlarge)
EURUSD Chart Forecast
While the price has broken below the strong support level $1.17000 the next step is to reach the first strong support level. That is $1.15462 which was strong support in the past.
Before reaching that level the price could find smaller support at $1.16178 which was a nice resistance level when the price was moving up.
On the H4 time frame, it is visible that the price has found some resistance before entering into the range area at the end of July.
The market looks bearish and I am looking only for bearish signals for now. Until the price reaches the $1.15462 level I am not looking into bullish opportunities unless there is a strong bullish signal which is unlikely, but there is always a possibility.



Comments
Log in or sign up to join the conversation.