

STOCKS COME BACK, S&P 500 BOUNCE DRIVES GLOBAL RALLY
As we open Tuesday of our holiday-shortened week, markets have shown some interesting volatility as we approach the end of Q1. As we mentioned yesterday, with this being a holiday week in observance of Good Friday combined with both month and quarter-end flows, the prospect of ‘peculiar’ moves was a bit higher than usual. That has led into this morning’s rally in the US Dollar after a string of weakness that ran into last night; along with the bullish push across global equities after yesterday’s aggressive rally in American stocks on the heels of Friday’s nasty sell-off.
FROM FRIDAY FLOP TO MONDAY MOTIVATION, BUYERS RETURN TO THE S&P (HOURLY CHART)
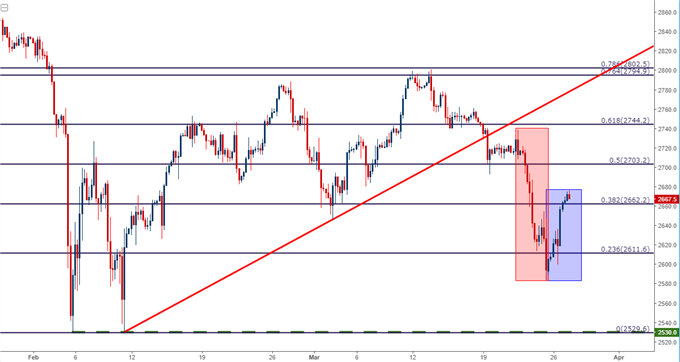
Chart prepared by James Stanley
DOLLAR RALLY KICKS OFF WITH THE EURO OPEN
The big item as we open the US session is a rally in the US Dollar that’s shown over the past few hours, coinciding with this morning’s European open. Dollar weakness remained fairly prominent through yesterday’s US session and well into Asia, with a quick test below the 89.00 level just before Europe opened for the day. But after that, USD strength began to show and hasn’t yet exhibited any signs of abating. At this point, DXY has rallied up to a zone of prior support, the same zone that we’d looked at yesterday for the ‘range within a range’.
US DOLLAR VIA ‘DXY’ FOUR-HOUR CHART: RALLY FROM MONTHLY LOWS, RESISTANCE SHOWS AT PRIOR SUPPORT
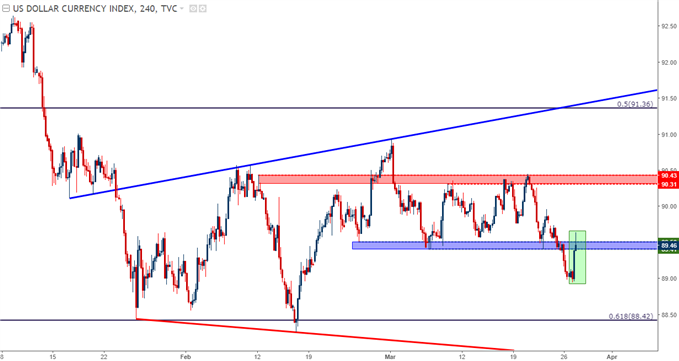
Chart prepared by James Stanley
DOLLAR BUMP LEADS TO EUR/USD SLUMP
Given the timing of this morning’s bump in the US Dollar, it would appear that at least some of this move is Euro-related, as the European currency comprises 57.6% of the US Dollar Index basket (DXY). A set of negative confidence reports that were released right around the time that USD started to surge would point to the fact that this move of Euro-weakness is helping to extend the rally in the US Dollar. At this point, EUR/USD is falling from the zone of resistance that we’d looked at yesterday that runs above the 1.2400 handle. The big question around the pair at this point is whether support shows at any of the three zones that we’ve been following.
A higher-low support test around 1.2335-1.2350 may coincide with a support test of the prior resistance trend-line, and this could make the bullish side of the setup that much more attractive if we do actually see some support begin to show in this area.
EUR/USD FOUR-HOUR CHART: SHY AWAY FROM RESISTANCE, CONFLUENT HIGHER-LOW SUPPORT POTENTIAL
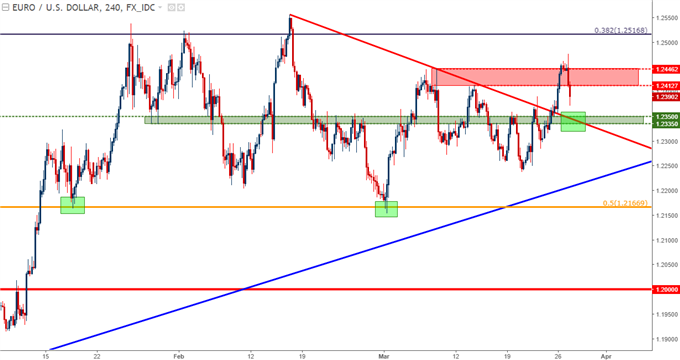
Chart prepared by James Stanley
GBP/USD TRIES TO DIG OUT SUPPORT ABOVE 1.4000
The British Pound is also sharply lower this morning, and this comes on the heels of what’s been a really strong month in the British currency. Yesterday, we’d looked at three potential support levels to work with bullish continuation in the pair. At this point, prices have run through two of the three without showing any sign of support, so the bullish approach would be left with one possible area of interest for a higher-low before the psychological level of 1.4000 comes into play. This zone runs from 1.4067-1.4088, and the key here is actually seeing support set, waiting for price action to indicate some element of bottoming as indicated by under-side wicks on the four-hour chart. If no support, no trade; let the market do what it’s going to do and you can always reevaluate later. It appears that this has already started to show after the close of the most recent hourly bar.
GBP/USD HOURLY CHART: PULLBACK TO ‘S3’ SUPPORT AFTER PRINT OF SEVEN-WEEK HIGHS
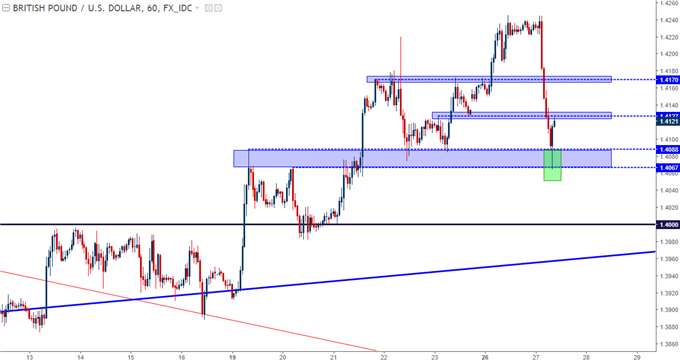
Chart prepared by James Stanley
USD/JPY BOUNCES FROM YEARLY LOWS
The US Dollar is even rallying against the Japanese Yen, and this is a downside trend that’s seen some considerable consistency as the pair has posted-lower throughout this year. On Thursday/Friday of last week, USD/JPY sank down to find support around 104.61, at which point grind began to show. The Sunday open saw prices start in this area, but since then we’ve seen a bit of lift as buyers have pushed the pair-up by more than 120 pips. The big question at this point is whether resistance shows inside of last week’s swing high, which came in around 106.61. This also coincides with a bearish trend-line that can be found by connecting the swing highs that have shown-up since February 21st, as indicated with the maroon bearish trend-line below.
USD/JPY FOUR-HOUR CHART: RALLY EXPOSES LOWER-HIGH RESISTANCE POTENTIAL BELOW LAST WEEK’S HIGH
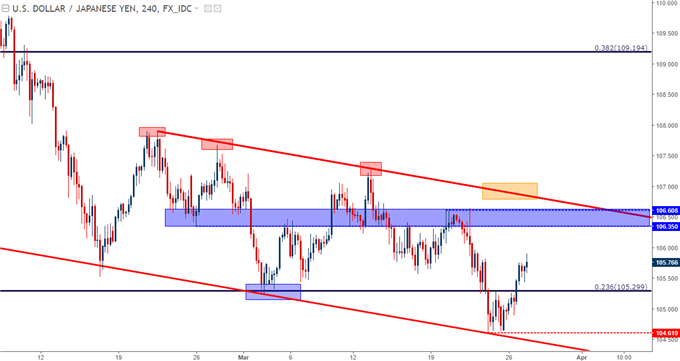
Chart prepared by James Stanley



Comments
Log in or sign up to join the conversation.