
EUR/USD
4 hour
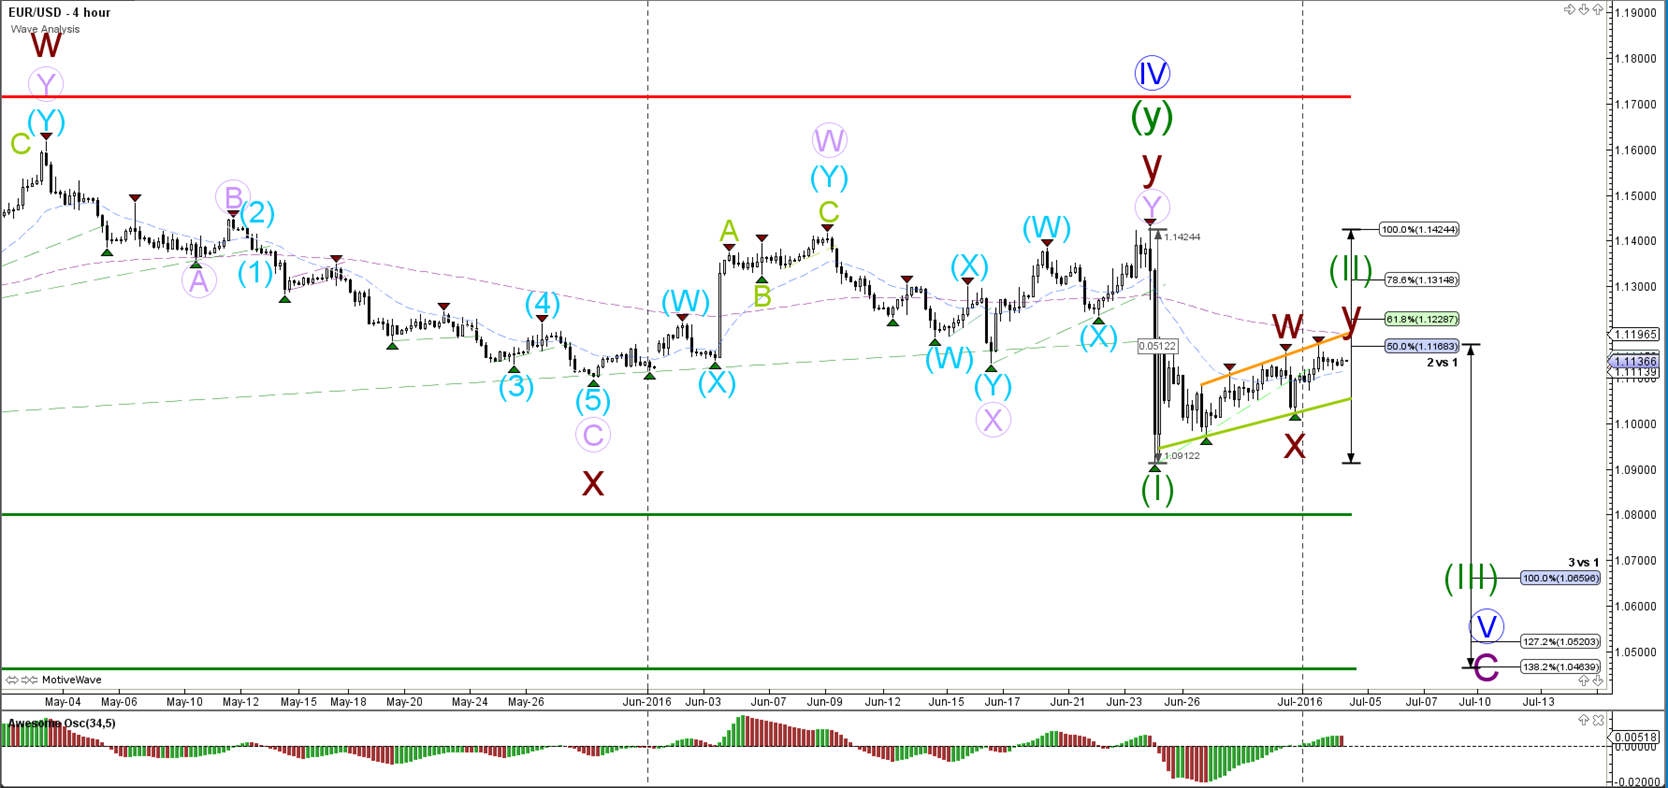
The EUR/USD is expanding the wave 2 (green) correction via a WXY (brown). A bearish breakout could lead to a continuation of the bearish momentum (wave 1 green) and could therefore be the start of a wave 3 (green).
1 hour
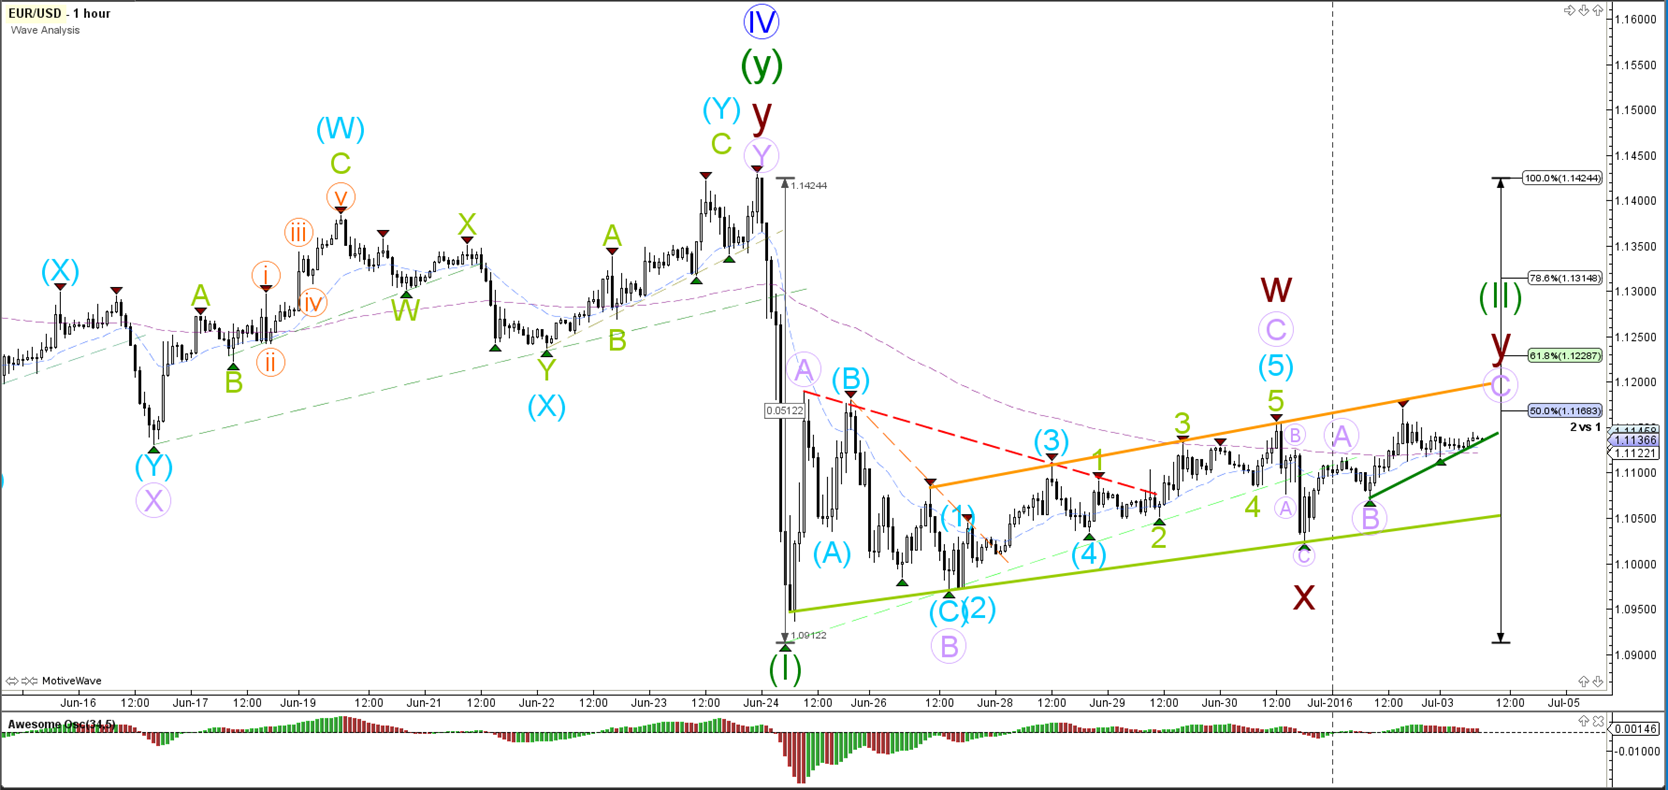
The EUR/USD is building a bear flag chart pattern (orange/green lines). The Fibonacci levels of wave '2 vs 1' should act as resistance but a break above the 100% level invalidates the current wave structure.
GBP/USD
4 hour
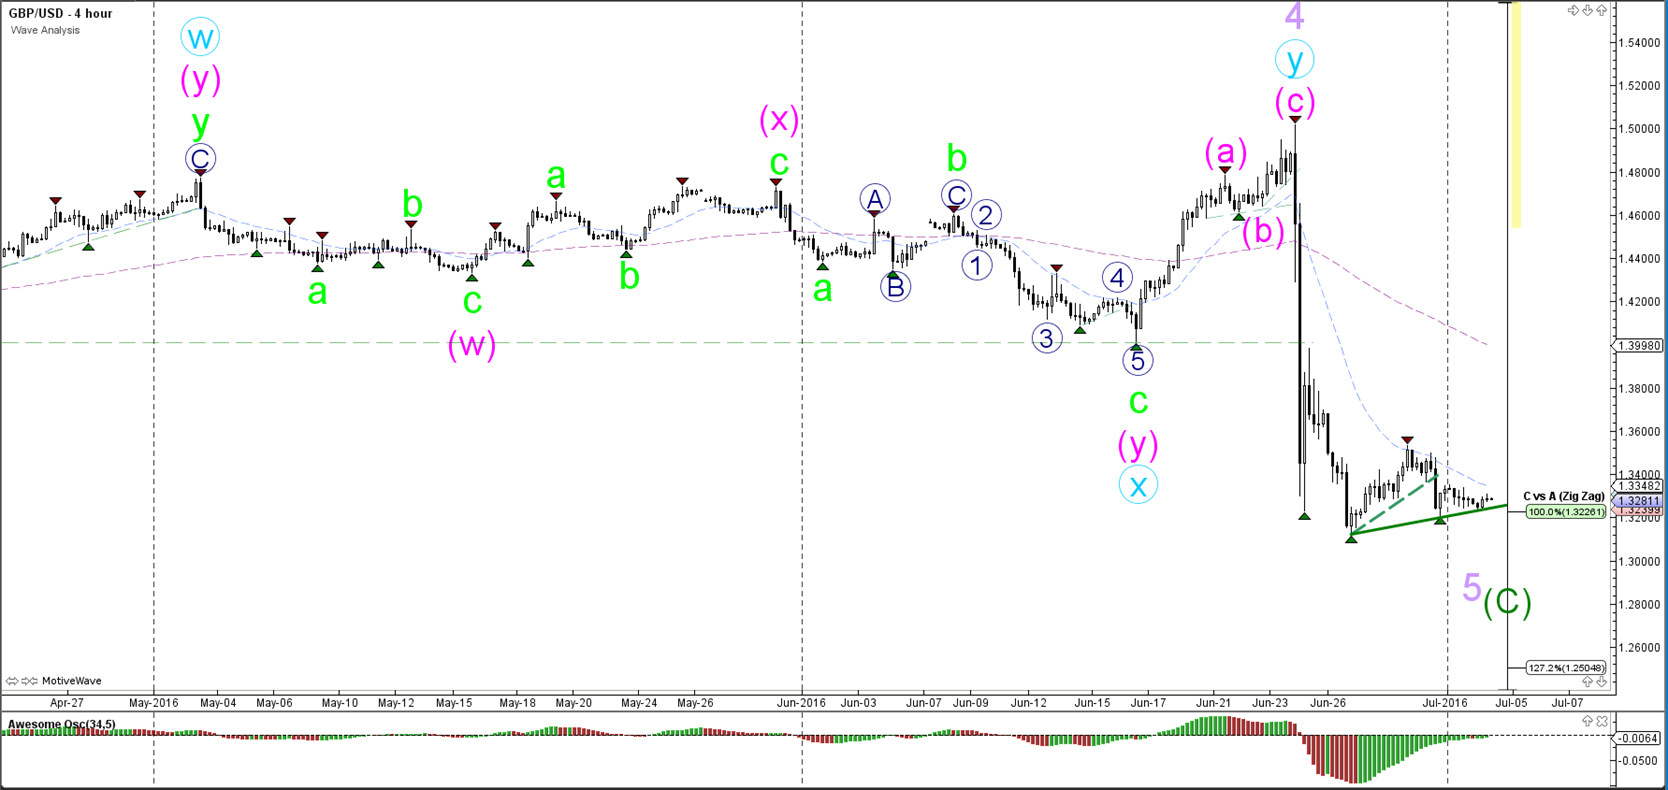
The GBP/USD is building a consolidation at the 100% Fibonacci target of wave 'C vs A'. A break below the support trend line (green) could see price continue with its bearish momentum towards the next 127.2% Fibonacci target.
1 hour
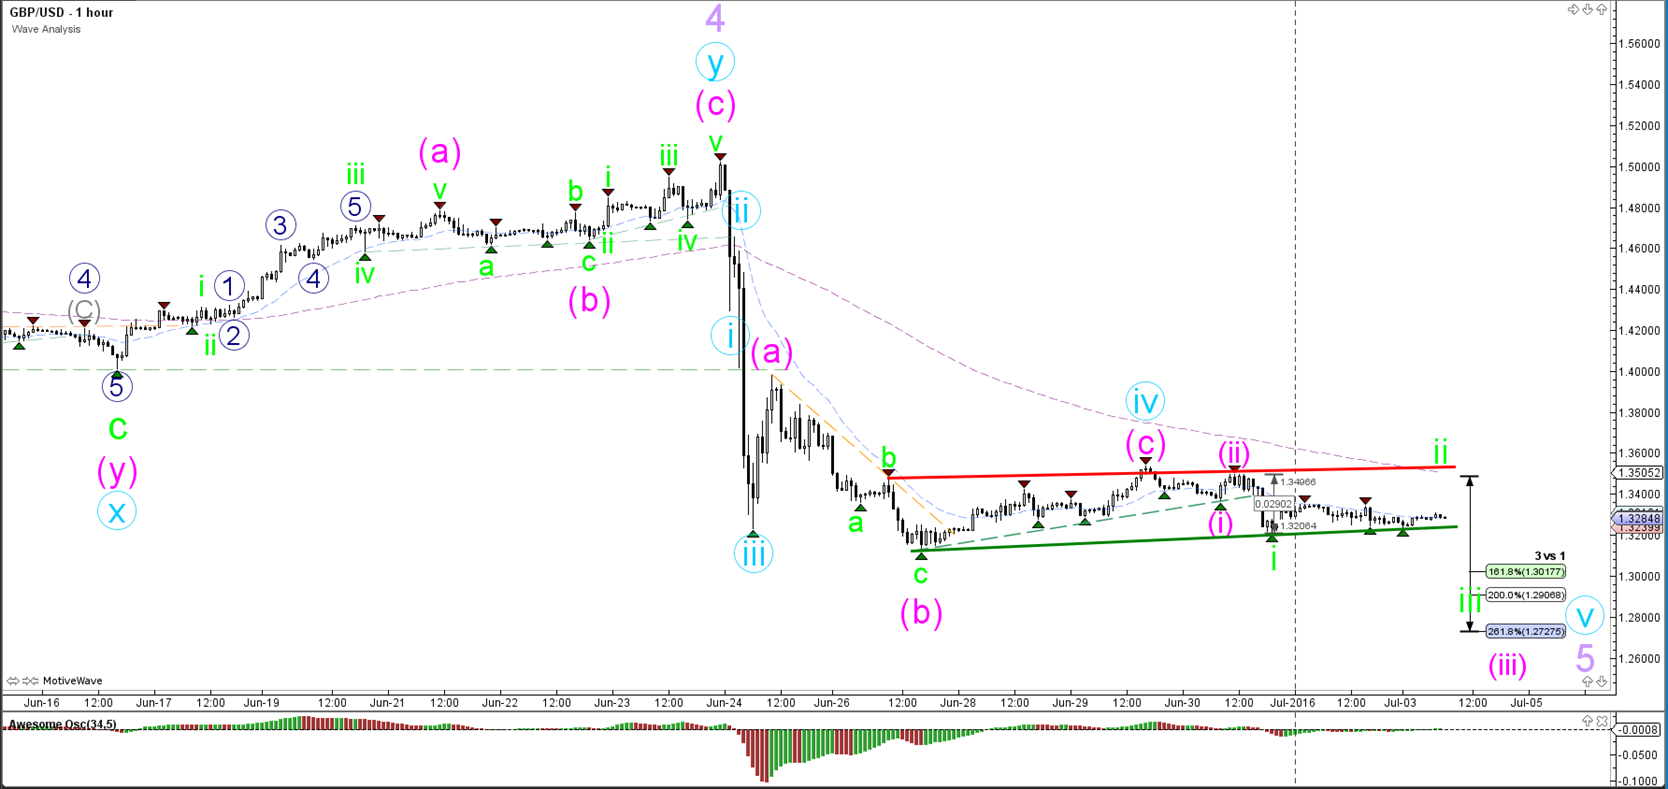
A GBP/USD is showing lack of bullish initiative so far as price action moves sideways in a bear flag chart pattern (green/red lines). For the moment a wave 1-2 (green/pink) explains the wave structure the best unless price breaks above the red trend line, which would most likely indicate an expansion of the wave 4 (blue).
USD/JPY
4 hour

The USD/JPY is behaving correctively as it moves away from the bottom of the downtrend channel. This makes a wave B (green) the most likely scenario at the moment. Price would need to break above the 100% Fib level before waves Y (blue/brown) can be considered completed.
1 hour
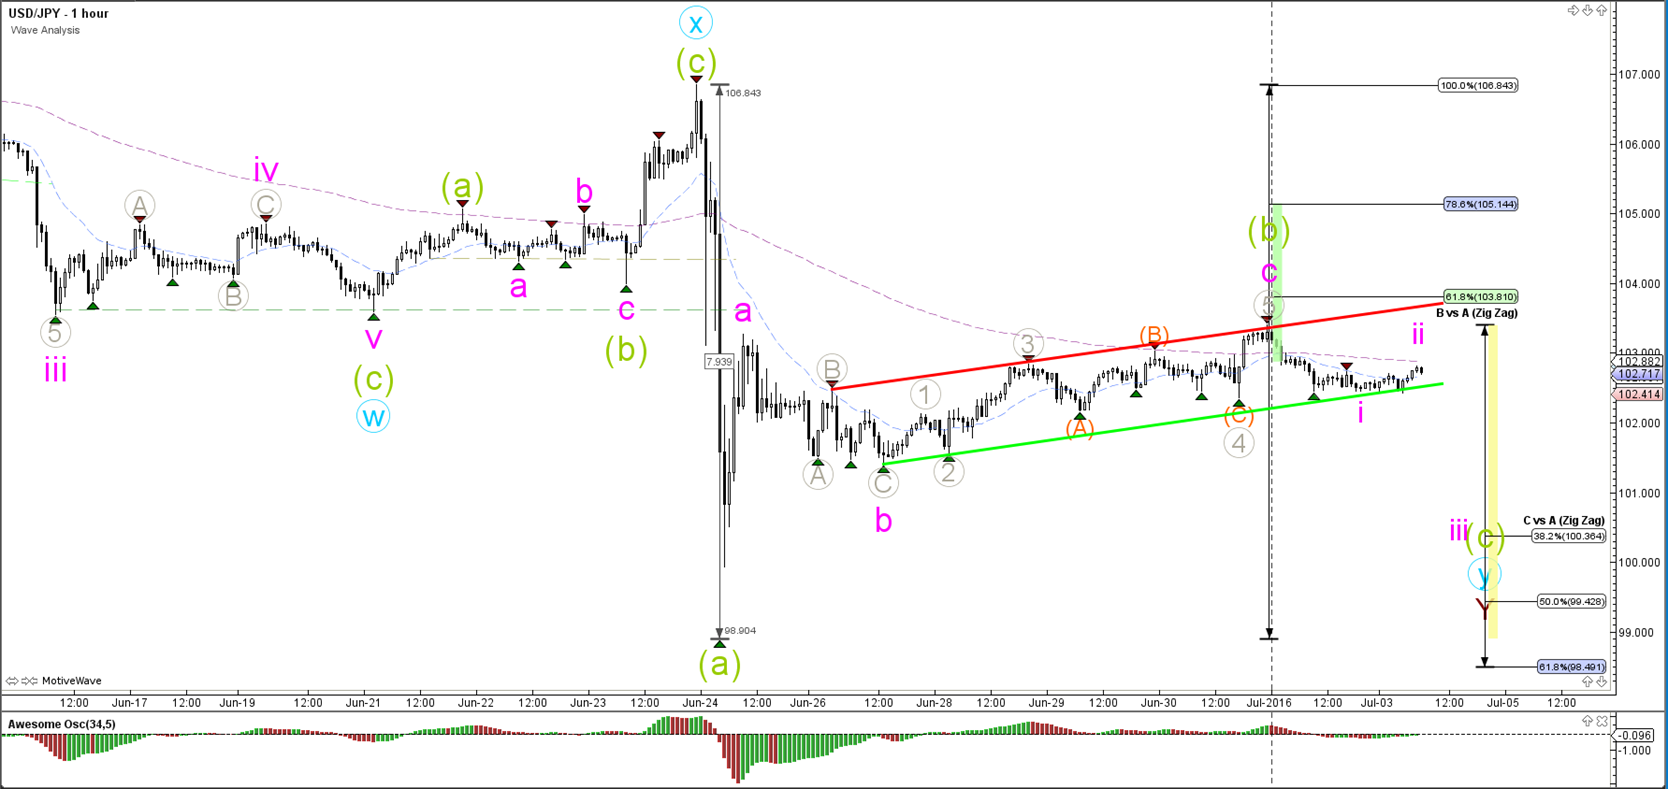
The USD/JPY is building a channel (red/green lines). A break above the pattern should see price stop at the Fibonacci retracement levels whereas a break below the support (green) should spark the breakout if the bears can keep control with good candle closes near the low.


Comments
Log in or sign up to join the conversation.