

The week started in a bullish mode and ended with a bullish candle. After breaking above $1.17200 on Monday which was previous support, that level now acted as a support.
The price nearly reached $1.17200 two days in a row by retracing back, but it could not stay there for too long. Same day the price moved higher and closed the day higher than the previous day.
That was a sign of bulls, but the week ended right on the weekly up trend line which now acts as a resistance.
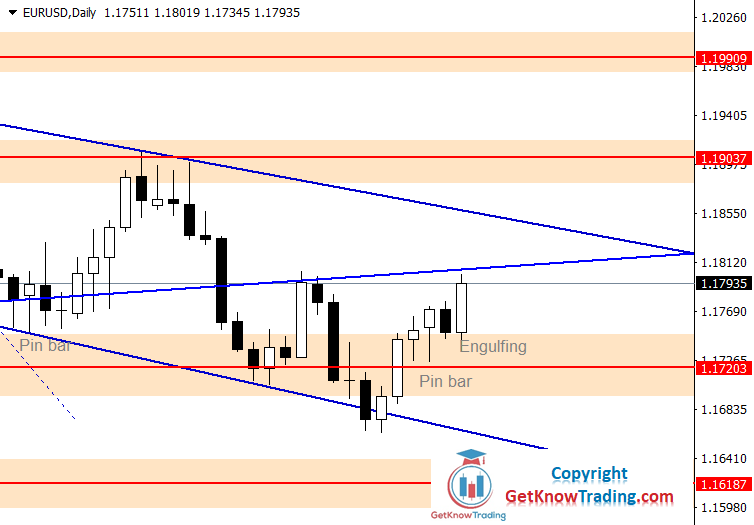
On the chart we have a downtrend channel where the price reached the bottom side and then reversed back up and now has stopped right on the weekly uptrend line which represents resistance for the price.
This weekly uptrend line in the previous week acted as a resistance for the price when making a retrace from the $1.17200 support.
In this case we could see the same scenario. But how the market looks we could see the price moving higher up to around $1.18500 where the downtrend resistance line is.
$1.18500 is a confluence of resistance where the sellers could find more strength to push the price back down. Daily downtrend line resistance and weekly uptrend line resistance could pose a strong selling pressure.
The current market overview shows the $1.17200 as a support that needs to be broken in order to see the price moving down. The next goal for the bears is $1.16187 which is a strong support.
On the upper side we have now strong resistance and $1.19000 as a breakpoint for the buyers. If they manage to break above, $1.20000 would be the next target.



Comments
Log in or sign up to join the conversation.