

Image Source: Kyle Glenn on Unsplash
The EUR/USD exchange rate suffered its biggest drop since July of last year as investors moved to the safety of the US dollar. It ended the week at 1.1615, down from the year-to-date high of 1.2088.

Iran War and US Consumer Inflation Report Data
The EUR/USD pair retreated as investors moved to safe havens with the start of the war in Iran. The dollar largely jumped against other currencies, but the greenback pared some of its gains after the Bureau of Labor Statistics (BLS) released the February jobs report.
This report revealed that the economy lost 92,000 jobs in February, the worst performance in years. The unemployment rate also ticked upwards to 4.4%.
Looking ahead, the currency pair will react to the new developments in Iran, as the war has pushed European natural gas prices to the highest level in years. These soaring gas prices will lead to more inflation in the region and likely affect the economic growth.
Signs that the war is continuing will be bearish for the EUR/USD pair as investors continue to move to safe havens.
The pair will also react to the upcoming US inflation report, which comes out on Wednesday this week. Economists polled by Reuters expect the upcoming report to show that the headline Consumer Price Index (CPI) rose from 2.4% in January to 2.5% in February. Core inflation is expected to remain unchanged at 2.5%.
These numbers mean that the Federal Reserve will be in a bind. Cutting interest rates to boost the economy will likely lead to a higher inflation rate, while hiking rates will affect the economic growth.
Other key catalysts for the EUR/USD pair will be the personal consumption expenditure (PCE) report and housing starts on Friday.
EUR/USD Technical Analysis
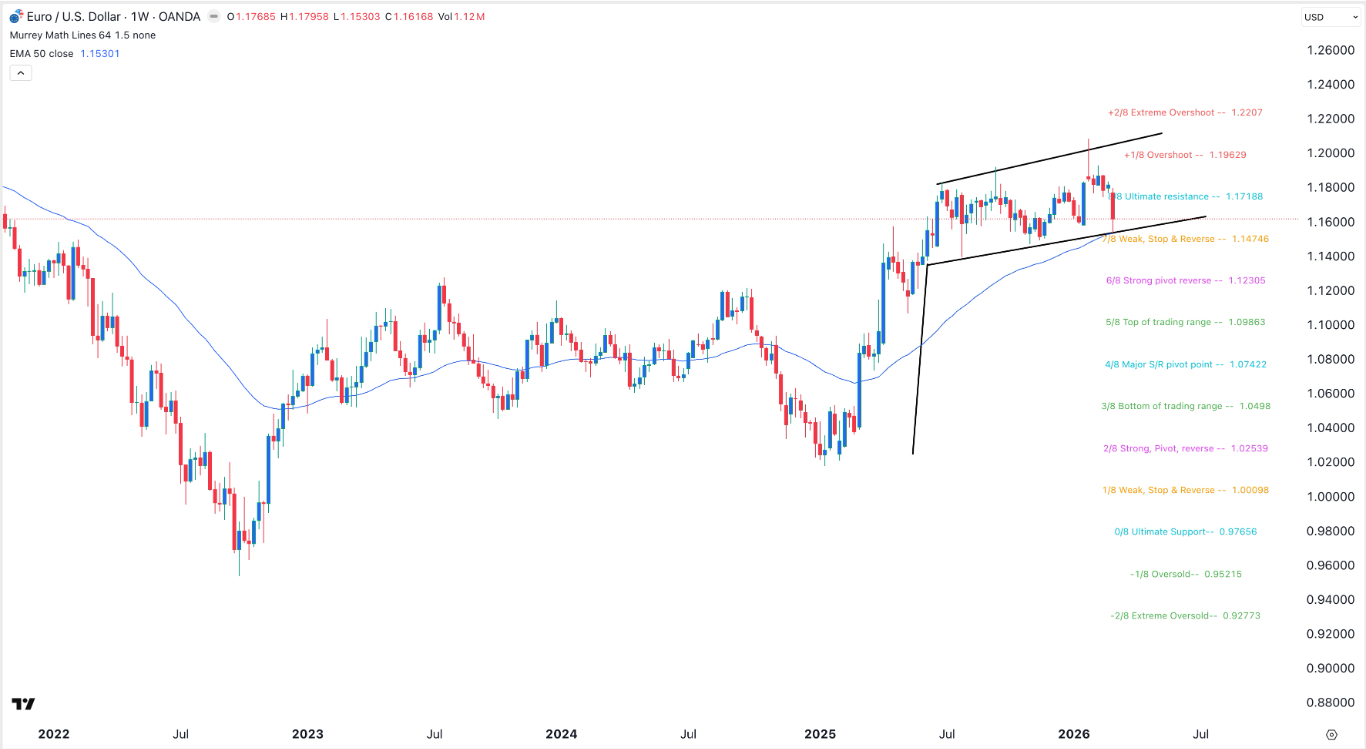
The weekly timeframe chart shows that the EUR/USD pair has pulled back in the past few weeks, moving from a high of 1.2088 in January to the recent settle at the 1.1615 mark. It has moved below the ultimate support level of the Murrey Math Lines tool at 1.1788.
The pair has remained above the 50-week Exponential Moving Average (EMA). It has also formed a hammer candlestick pattern, a common bullish reversal sign.
The pair has also formed a bullish flag pattern, which is made up of a vertical line and a channel. Therefore, the pair will likely bounce back and possibly retest the key resistance level at the 1.1800 mark. A move below the lower side of the channel would invalidate the bullish outlook.
Comments
Log in or sign up to join the conversation.