
EUR/USD
4 hour
(Click on image to enlarge)
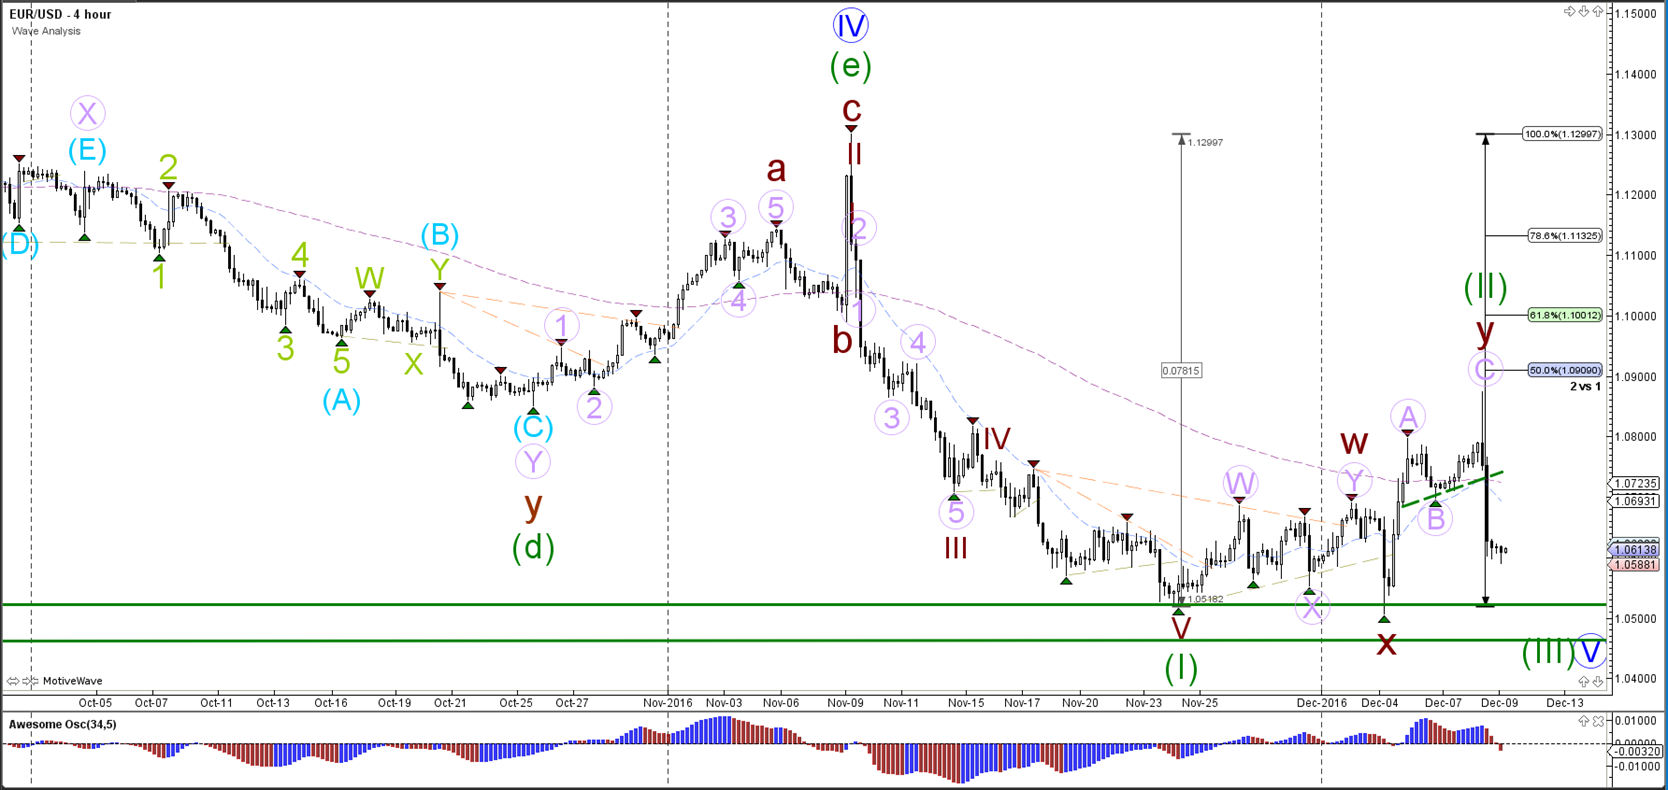
The EUR/USD completed a bullish ABC zigzag (purple) as expected and price turned at the Fibonacci levels of wave2 (green). The strong decline could be part of a wave 3 (green) if price manages to break below the weekly support zone (green lines).
1 hour
(Click on image to enlarge)

The EUR/USD bearish price action seems to have completed a wave 1 (brown) and price could build a retracement within wave 2 (brown). A break above the 100% level invalidates the wave 1-2 (brown) count.
GBP/USD
4 hour
(Click on image to enlarge)
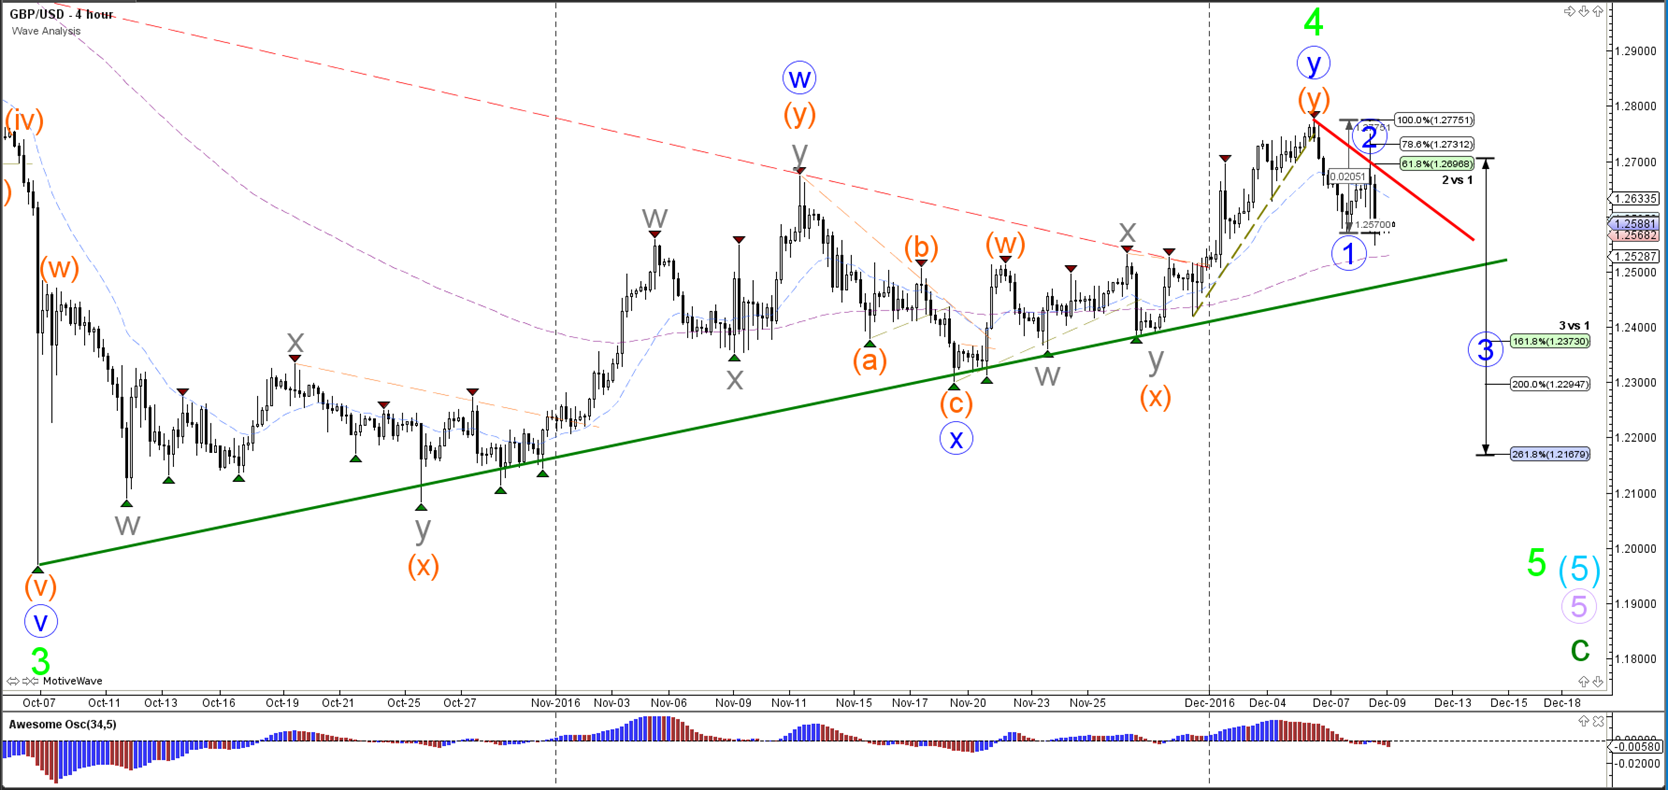
The GBP/USD also showed a bearish turn at the 61.8% Fibonacci retracement level, which could be part of a larger wave 1-2 (blue). A break below the support trend line (green) is needed before a larger wave 3 (blue) within waves 5 is possible.
1 hour
(Click on image to enlarge)

The wave 3 (blue) becomes invalidated if price manages to break above the 61.8% Fibonacci resistance level of wave 4 (orange). A break below the support (green) could see a wave 5 of wave 3 (blue) develop.
USD/JPY
4 hour
(Click on image to enlarge)
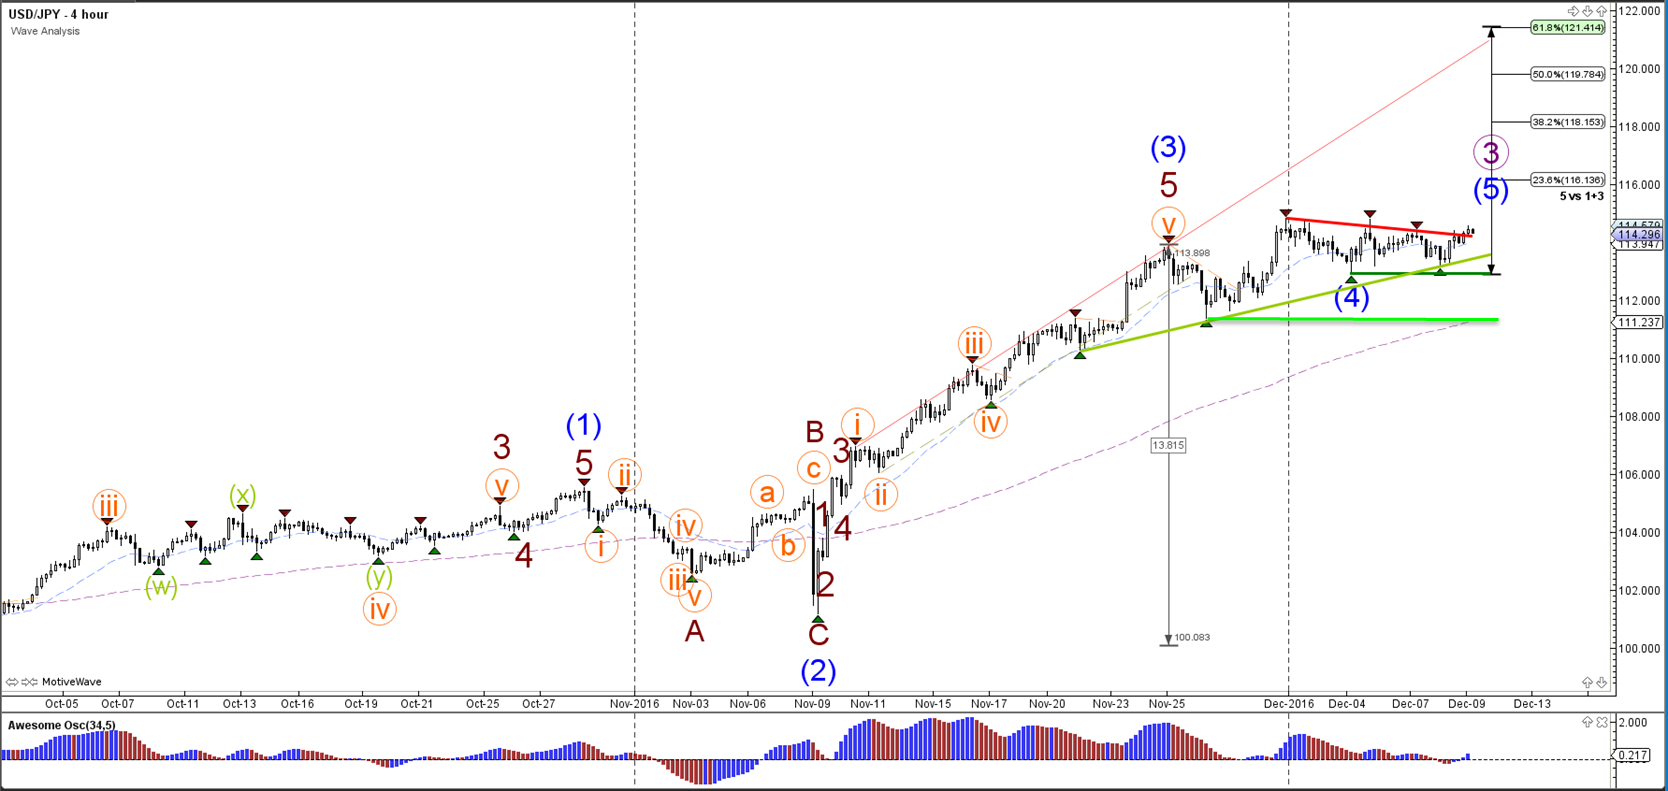
The USD/JPY uptrend is showing a larger correction and consolidation zone. A break above resistance (red) could see price continue higher towards the Fib targets of wave 3 (brown). A break of support (green) could see a larger retracement develop towards previous bottoms (light green).
1 hour
(Click on image to enlarge)
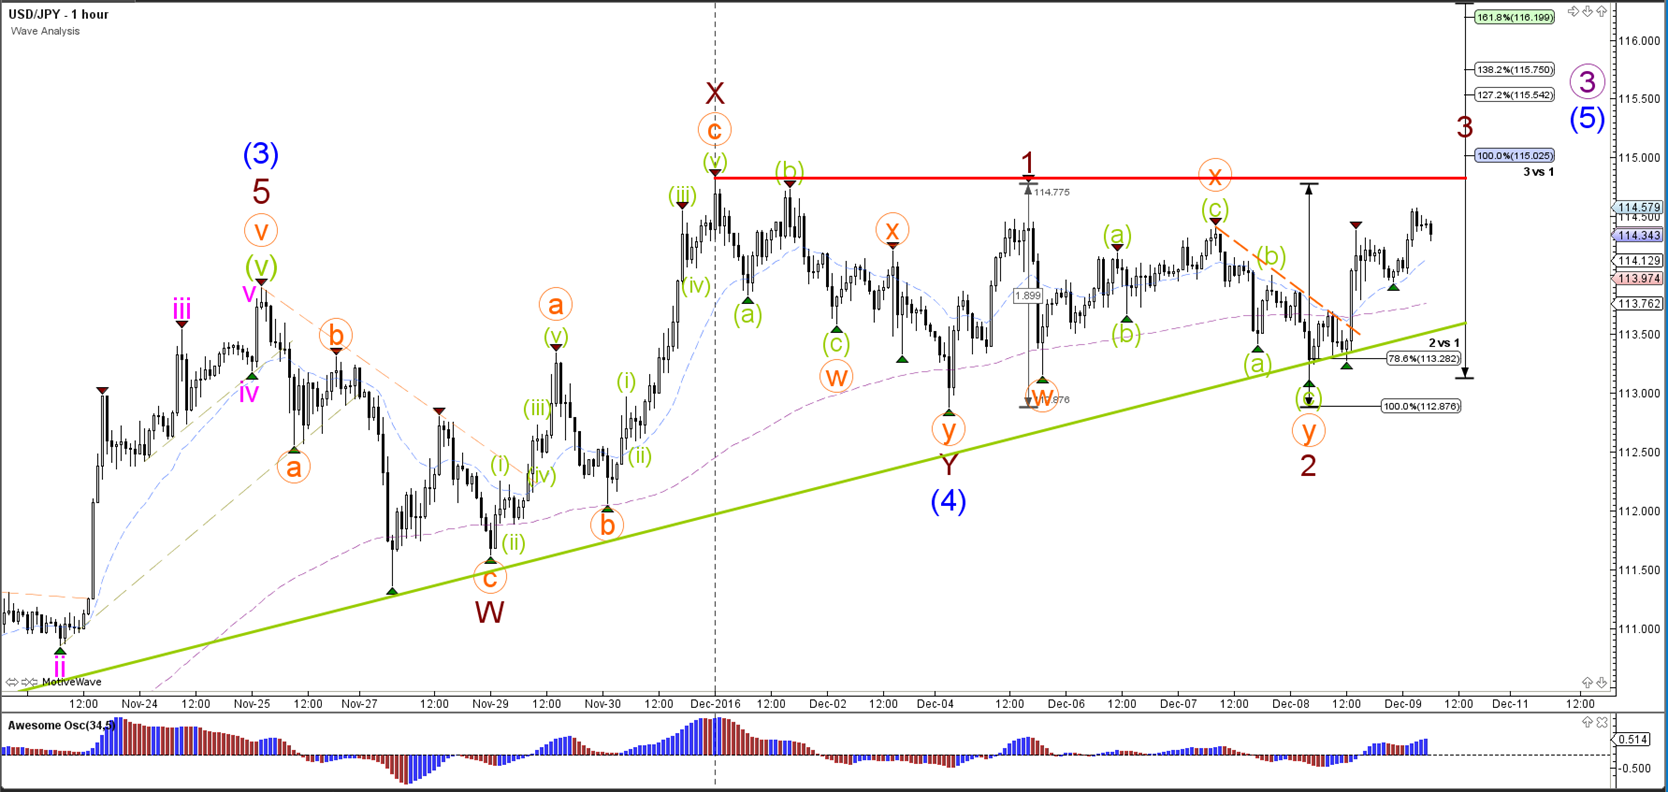
The USD/JPY bounced at the 78.6% Fibonacci support level. Price would need to break above the previous tops (red) before a breakout and a wave 3 (brown) become possible or else the wave count is vulnerable to change as price expands the correction sideways.


Comments
Log in or sign up to join the conversation.