
This is a slightly contrarian view in a sense there is a consensus in the market that the common currency is on a one-way route to parity against the US dollar.
We agree that the EUR/USD pair is set to drop to parity levels, however, a notable correction is more likely than not in the short-run.
EUR/USD - A case for correction
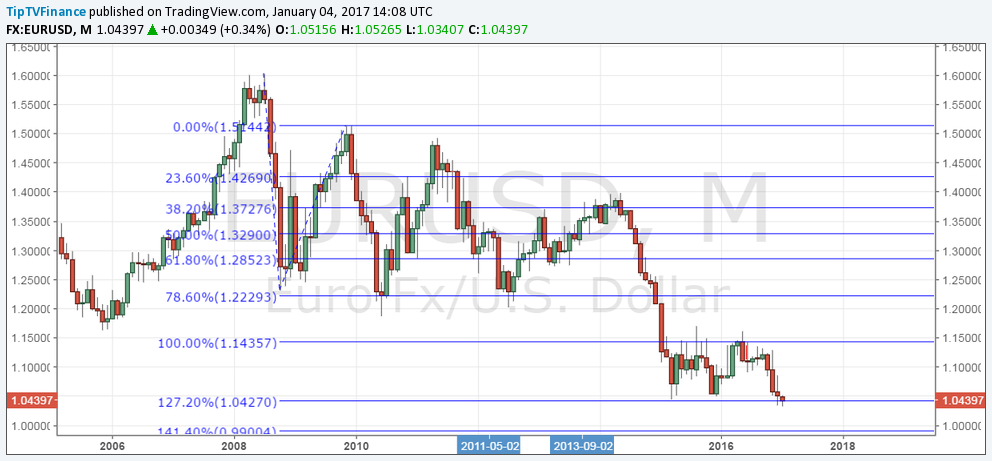
Monthly chart
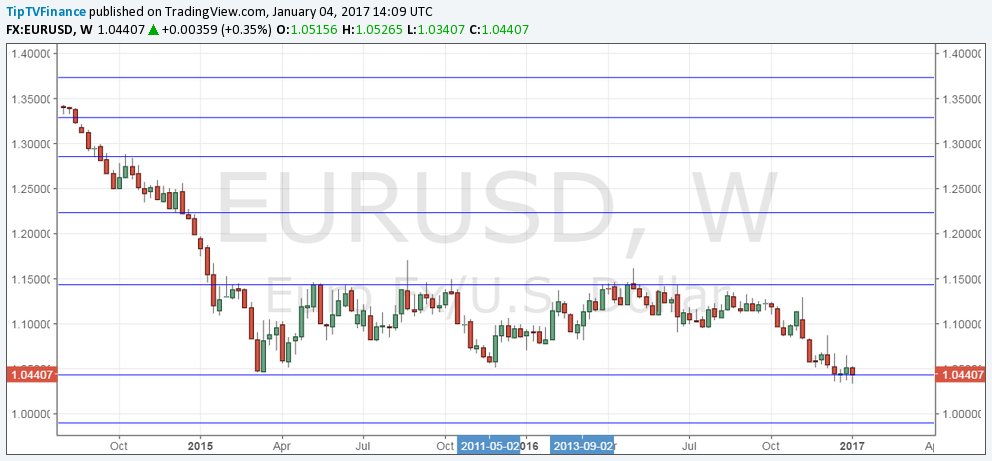
Weekly chart
Sellers running out of steam below 127.2% Fib extension: If we draw Fib extension levels from 2008 high to Oct 2008 low to Nov 2009 high, we get 127.2% level at 1.0427 levels.
Now check out the monthly chart and the weekly chart. We can clearly note that sellers are having a tough time keeping the pair below 1.0427 levels. The exhaustion is more evident on the weekly chart.
Spinning bottom at critical support on the monthly chart: Last month’s candle is a spinning bottom, which is a signal the bears have run out of steam. This goes well with the fact that the pair has been steadily losing height since May 2016. Moreover, the spinning bottom has appeared bang on at the critical support of 1.0427 (127.2% Fib).
Death cross is a lagging indicator: The monthly chart shows death cross - bearish crossover between the 50-MA and 200-MA. This is a lagging indicator as it takes a major sell-off to result in a bearish crossover. This means a major move has already played out most of the times, thus a correction is often seen following a confirmation of the ‘death cross’.
Bullish divergence on the daily chart: The daily chart shows falling bottoms on the price chart accompanied by the rising bottoms on the RSI.
Fresh selling needs a monthly close below 1.0427: Note that the pair has been largely restricted to a range of 1.0427 (127.2% Fib) and 1.1436 (100% Fib) since March 2015. A break above 1.1436 (100% Fib) have repeatedly run into offers.
EUR/USD long-run view - Parity more likely than ever
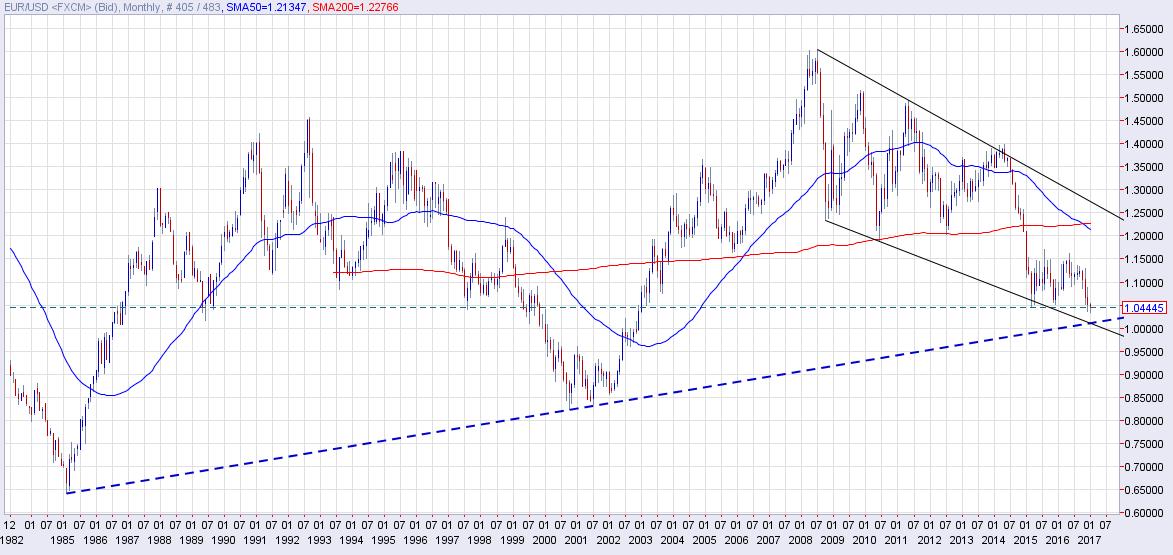
Monthly chart
The falling channel formation suggests the spot is likely to test the confluence of the rising trend line and channel support around parity levels.
Long-run bearish invalidation is seen only if the spot sees a monthly close above 1.1436.
_636324431350288293.png)
Comments
Log in or sign up to join the conversation.