

US DOLLAR BOUNCES FROM FIBONACCI SUPPORT AT 96.47
The four-day drop in the US Dollar has finally found some element of support around the 96.47 Fibonacci level that’s been in-play in various ways over the past seven months. This is the same level that had helped to elicit resistance in the Greenback in August of last year. This same level also became an area of support in December, resistance in January and here in March, support again. This is the 23.6% retracement of the 2011-2017 major move in DXY.
This presents an interesting backdrop for US Dollar bulls as prices have been working within the confines of an ascending triangle formation, taking the higher-lows that have been showing since September along with the horizontal resistance that’s built around 97.71 since November. This formation will often be approached with the aim of bullish breakouts, targeting fresh highs; and given the recent action of the ECB announcing a fresh round of stimulus, the fundamental backdrop appears as though it could be supportive of such a scenario.
US DOLLAR WEEKLY PRICE CHART
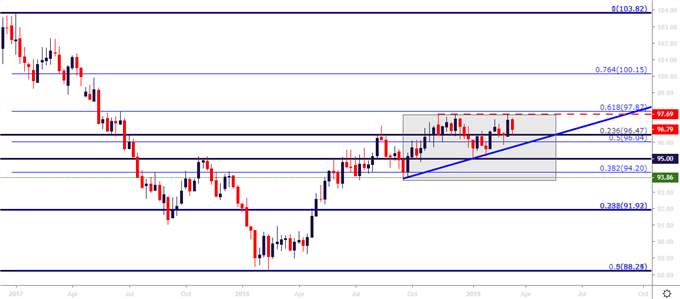
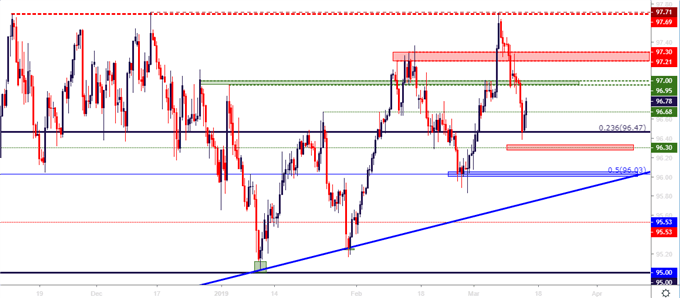
On a short-term basis, the big question is whether this support holds into another bullish run in the US Dollar, as the 97.71 level looms ominously above. That price has elicited three rather strong cases of resistance, in November, December and again last Friday. On the way up, buyers would have to encounter potential turbulence or resistance around the 97.00 level, which had failed to hold this week’s lows, followed by the 97.20-97.30 area that’s elicited a few different resistance inflections in mid-February and again on Tuesday of this week.
Below current price action, the 96.30 level remains of interest for support, followed by the zone around the 96.00 area, after which the trend-line connecting the September, 2018 and January 2019 lows comes into play.
US DOLLAR EIGHT-HOUR PRICE CHART
EURUSD INCLINE PULLS BACK: RANGE FILL OR BEARISH DRIVE?
Last Thursday produced an outsized bearish move in EURUSD as the European Central Bank announced a fresh round of TLTRO’s. And prices breached the under-side of a range formation that had been in play for the prior four months. But – as looked at in last Thursday’s webinar, that short-side move found support at an interesting spot just a little bit-lower on the chart around 1.1187, which is the 61.8% retracement of the 2017-2018 bullish uptrend in the pair.
Since that support has come into play, it’s been largely a one-way show in EURUSD as buyers have pushed prices back above the support-side of that prior range.
The result of what happens here will likely be visible through the above scenario in DXY: If EURUSD buyers are able to stage a greater campaign of strength, the US Dollar pullback will likely continue, and that opens the door to re-tests of 96.30 or 96.04. If, on the other hand, EURUSD bears are ready to re-test last week’s lows, the 97.71 level in DXY will likely be in full view and a topside breakout there could lead to further declines in EURUSD, perhaps testing as deep as the 1.1000 psychological level.
EURUSD HOURLY PRICE CHART
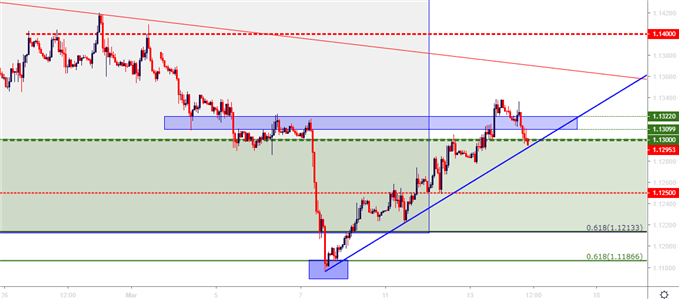
Chart prepared by James Stanley



Comments
Log in or sign up to join the conversation.