

The EUR/USD has been unable to break above the previous top. Price action is now testing the bottom of the 21 ema zone. This is a key decision zone for a bounce or breakout.
Price Charts and Technical Analysis
(Click on image to enlarge)
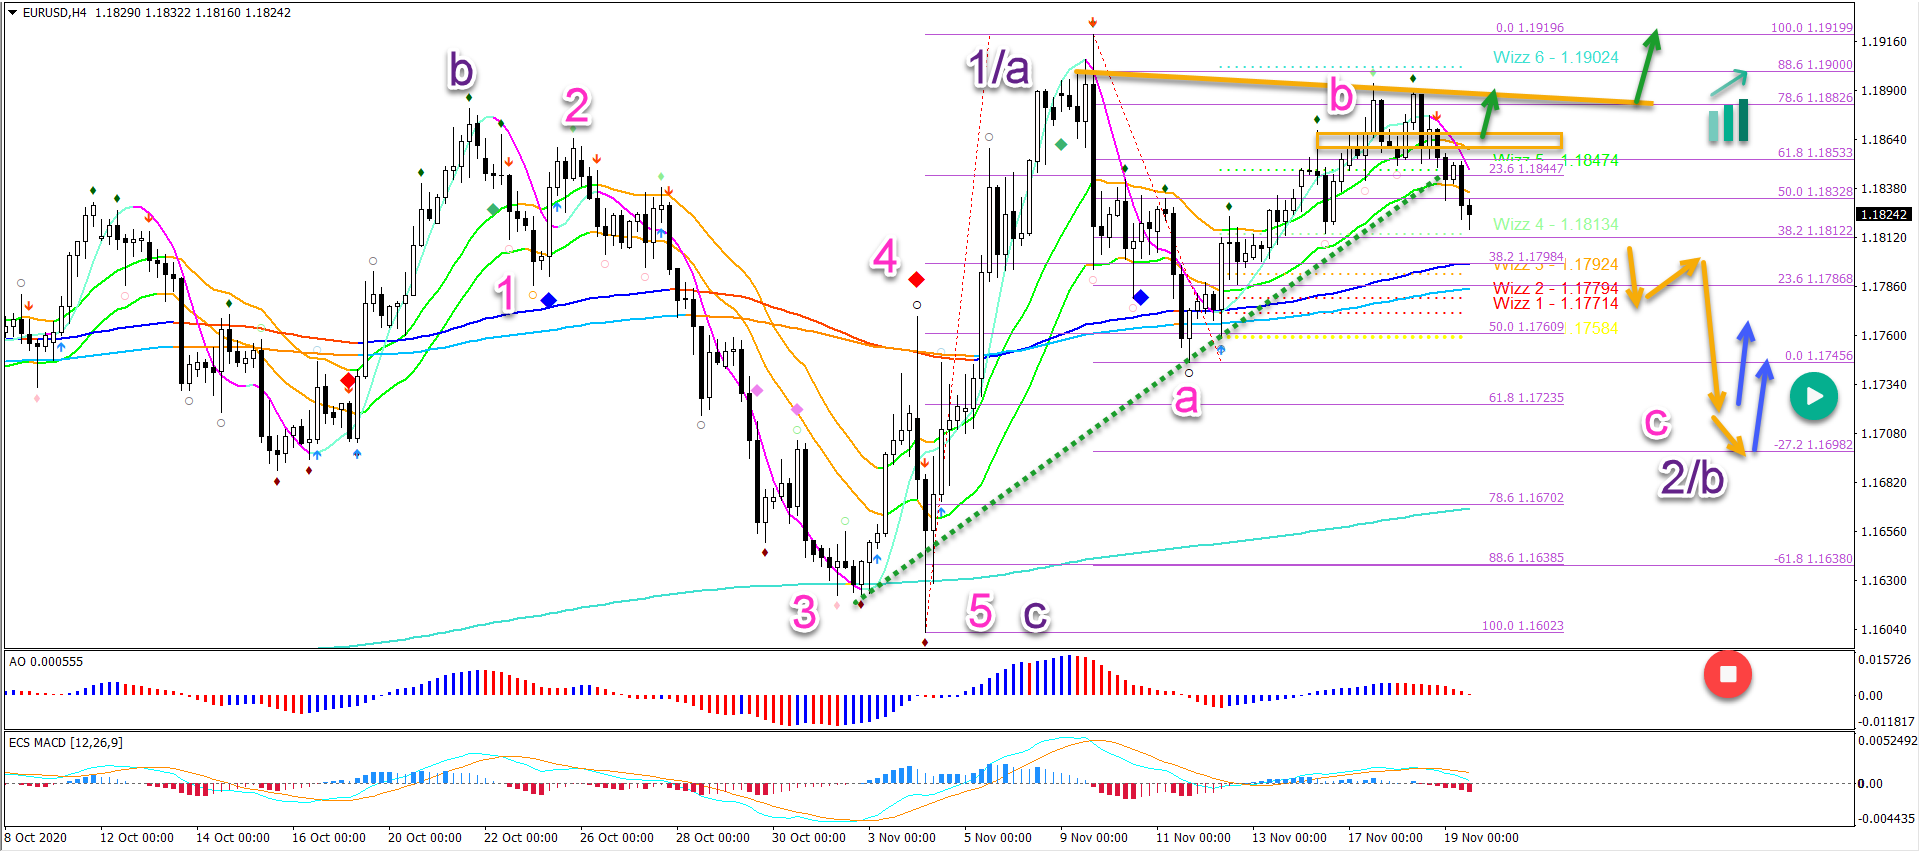
The EUR/USD break below the 144 ema confirms the end of the wave B (pink) and the bearish decline within wave C (pink).
- The main targets for the bears are the 61.8% and 78.6% Fibonacci retracement levels and the -27.2% target.
- A bounce at the Fibs (blue arrow) could confirm the bullish wave pattern (purple).
- A bearish breakout below the previous bottom at 1.1602 invalidates (red circle) the bullish wave 1/a and 2/b pattern (purple).
A bullish breakout above the resistance could indicate a surprise turn for an immediate upside (green arrows).
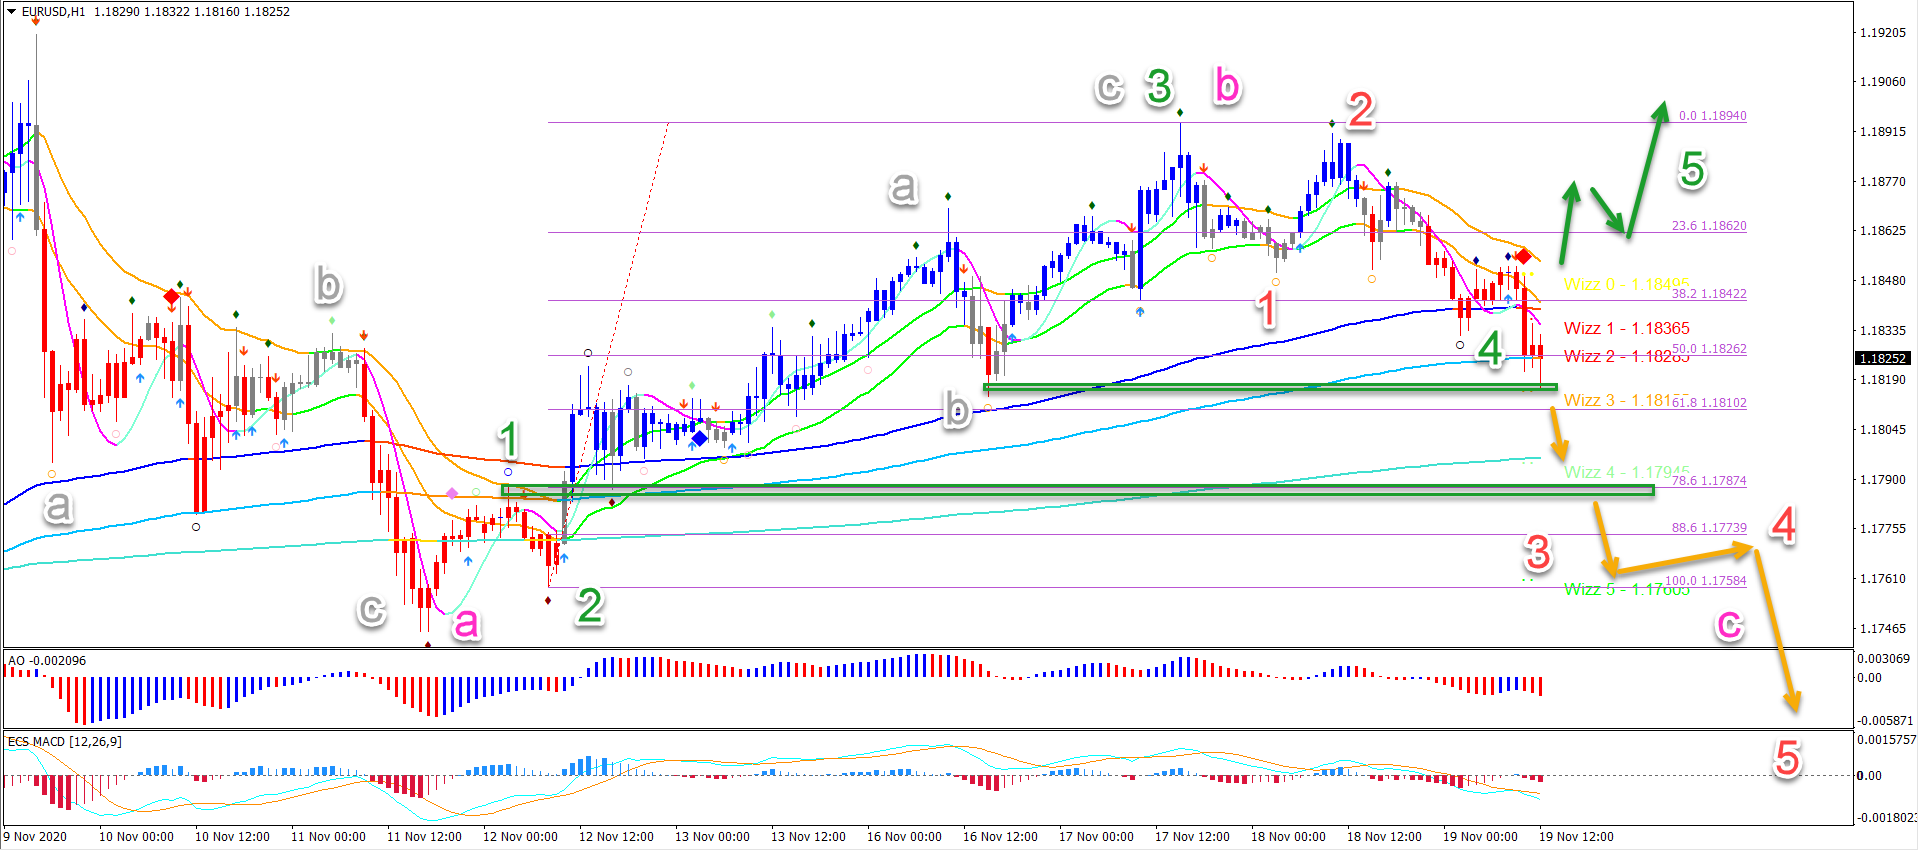
On the 1 hour chart, price action seems to be breaking below the 50% Fibonacci level.
- If price pushes below this Fib level and the top of wave 1 (green box), then the 5 wave pattern (green) is invalid.
- In that case, a bearish 5 wave (red) pattern is likely to take price action lower within wave C (pink).
- A bullish bounce at these Fibs without breaking support (green box) and then followed by a bullish breakout could indicate a wave 5 (green arrows)
(Click on image to enlarge)



Comments
Log in or sign up to join the conversation.