

EUR/USD
4 hour
(Click on image to enlarge)
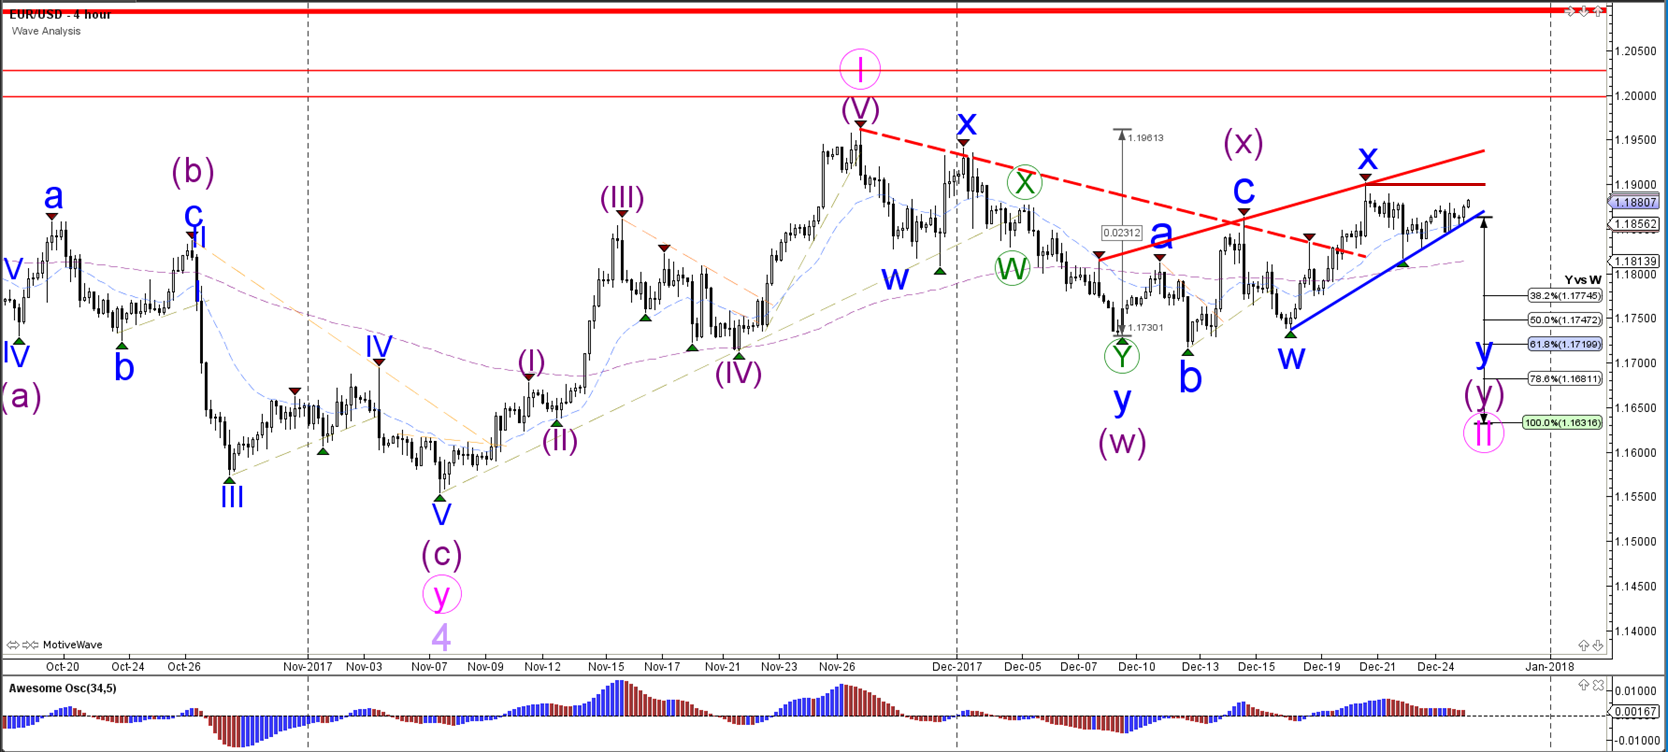
The EUR/USD is building a rising wedge chart pattern (red/blue lines). A bullish breakout could indicate a continuation of the uptrend whereas a bearish reversal could send the EUR/USD lower to test the wave 2 vs 1 (pink) and the Fib levels of wave Y (purple).
1 hour
(Click on image to enlarge)
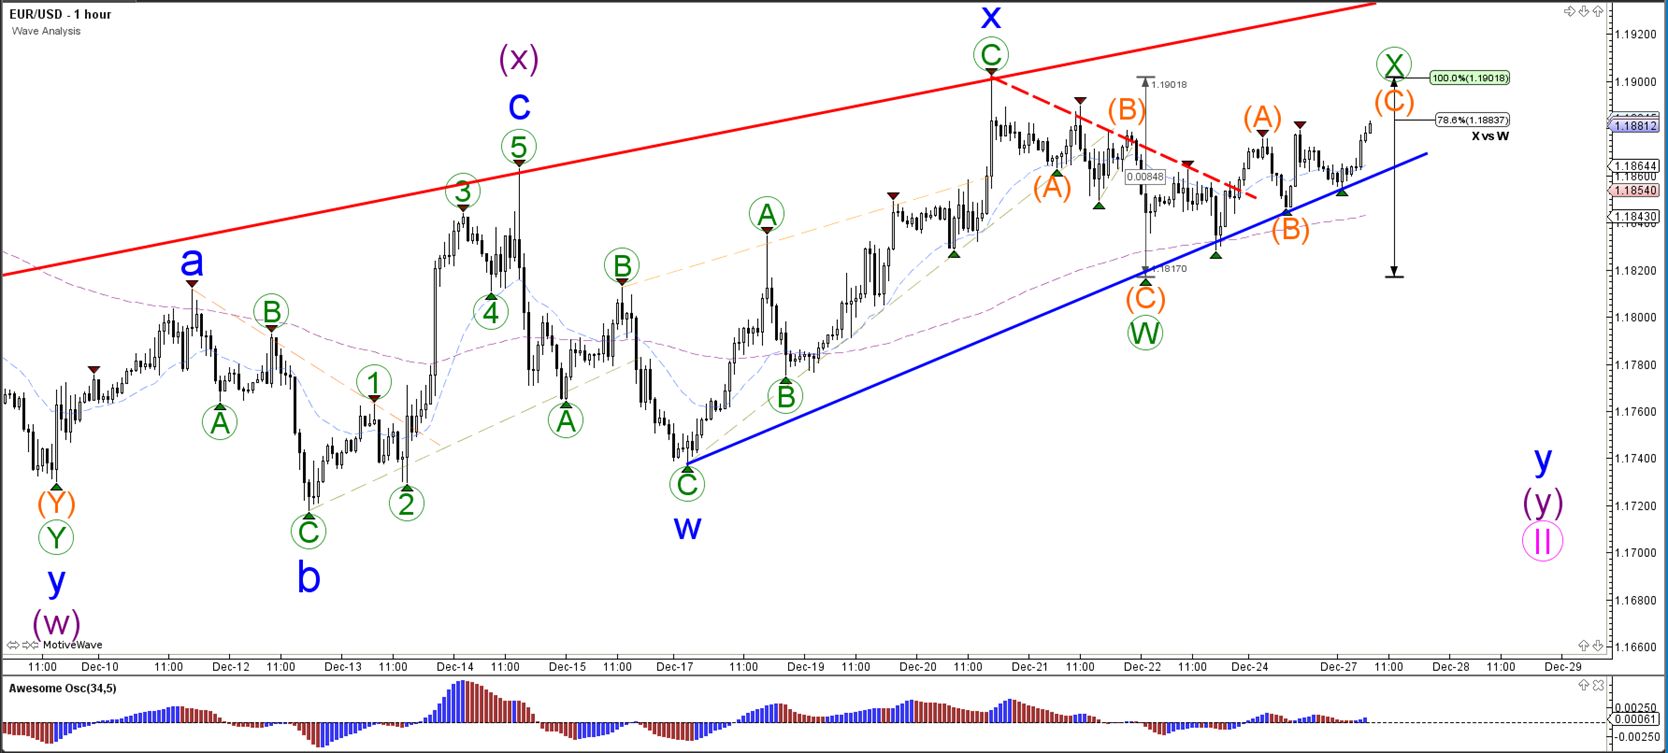
The EUR/USD is testing the Fibonacci levels of wave X (green). A break below the support trend line (blue) could be a larger bearish correction.
GBP/USD
4 hour
(Click on image to enlarge)
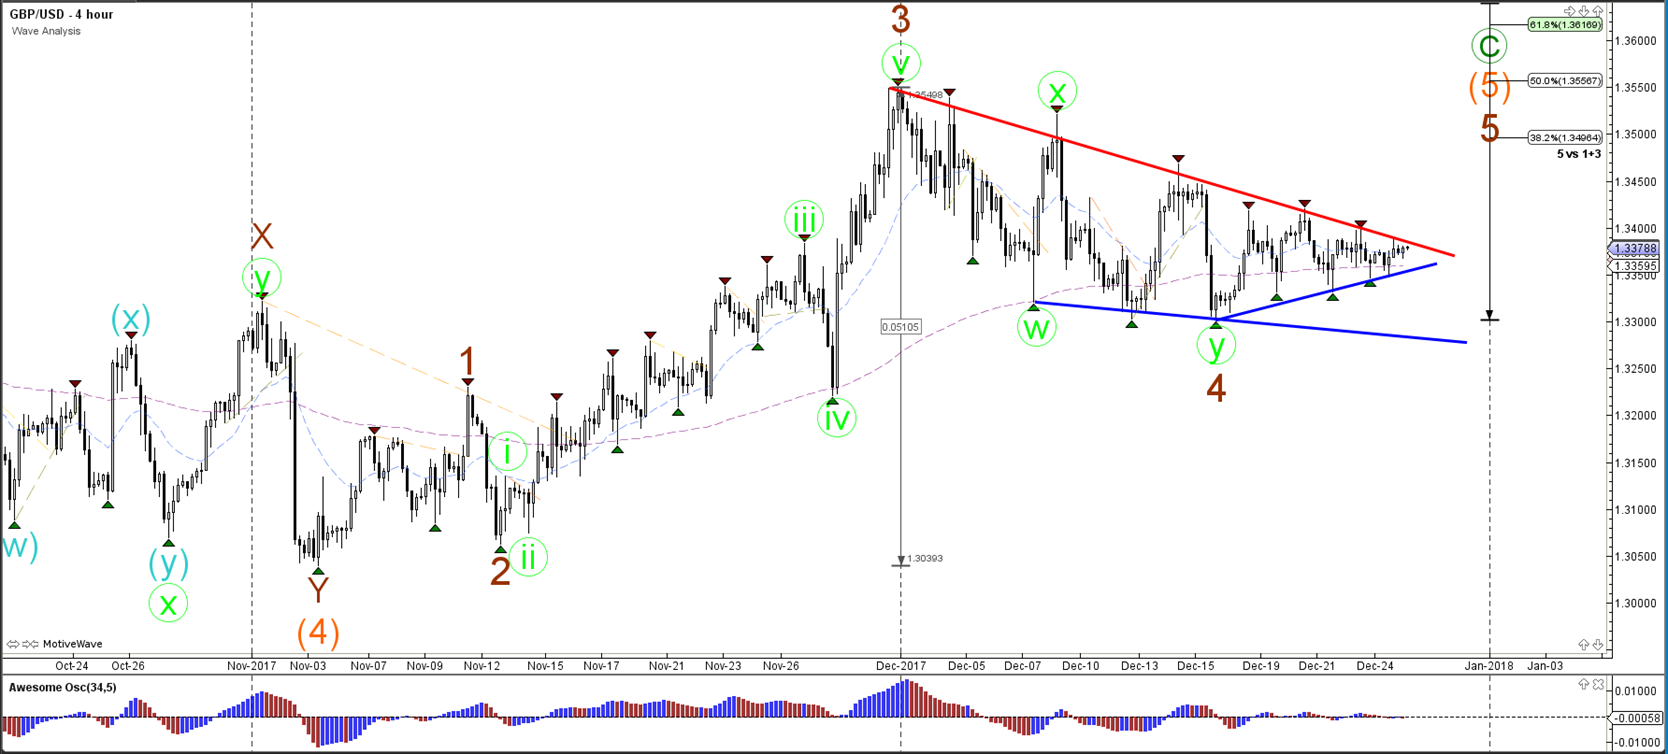
The GBP/USD is in a bull flag and triangle chart pattern, which is indicated by the support (blue) and resistance (red) trend lines. A bullish breakout could confirm a wave 5 of wave C. A break below the lowest support line makes a wave 4 less likely.
1 hour
(Click on image to enlarge)
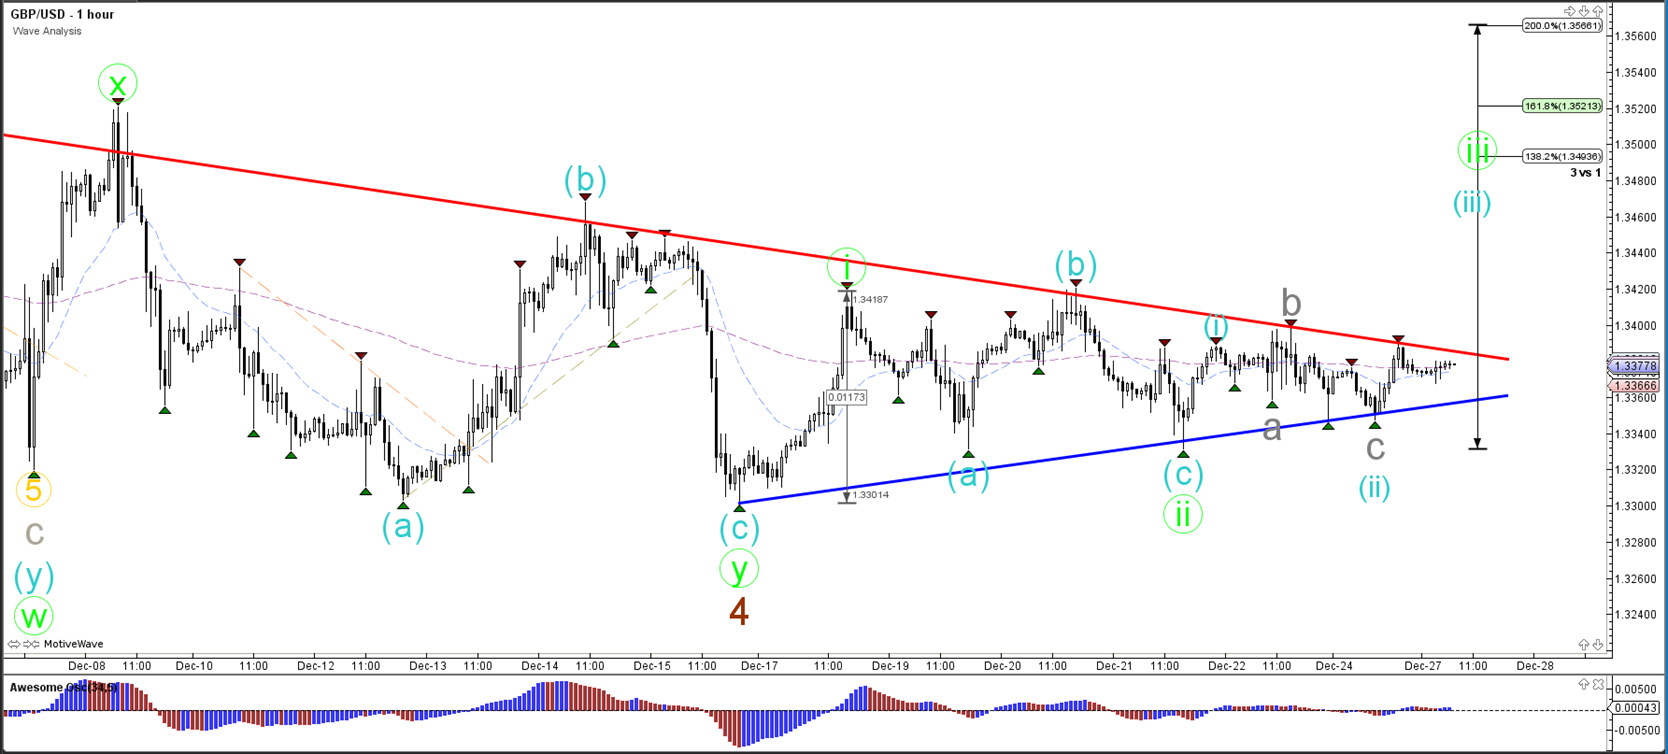
The GBP/USD seems to be building a potential ABC (blue) within a wave 3 (green).
USD/JPY
4 hour
(Click on image to enlarge)
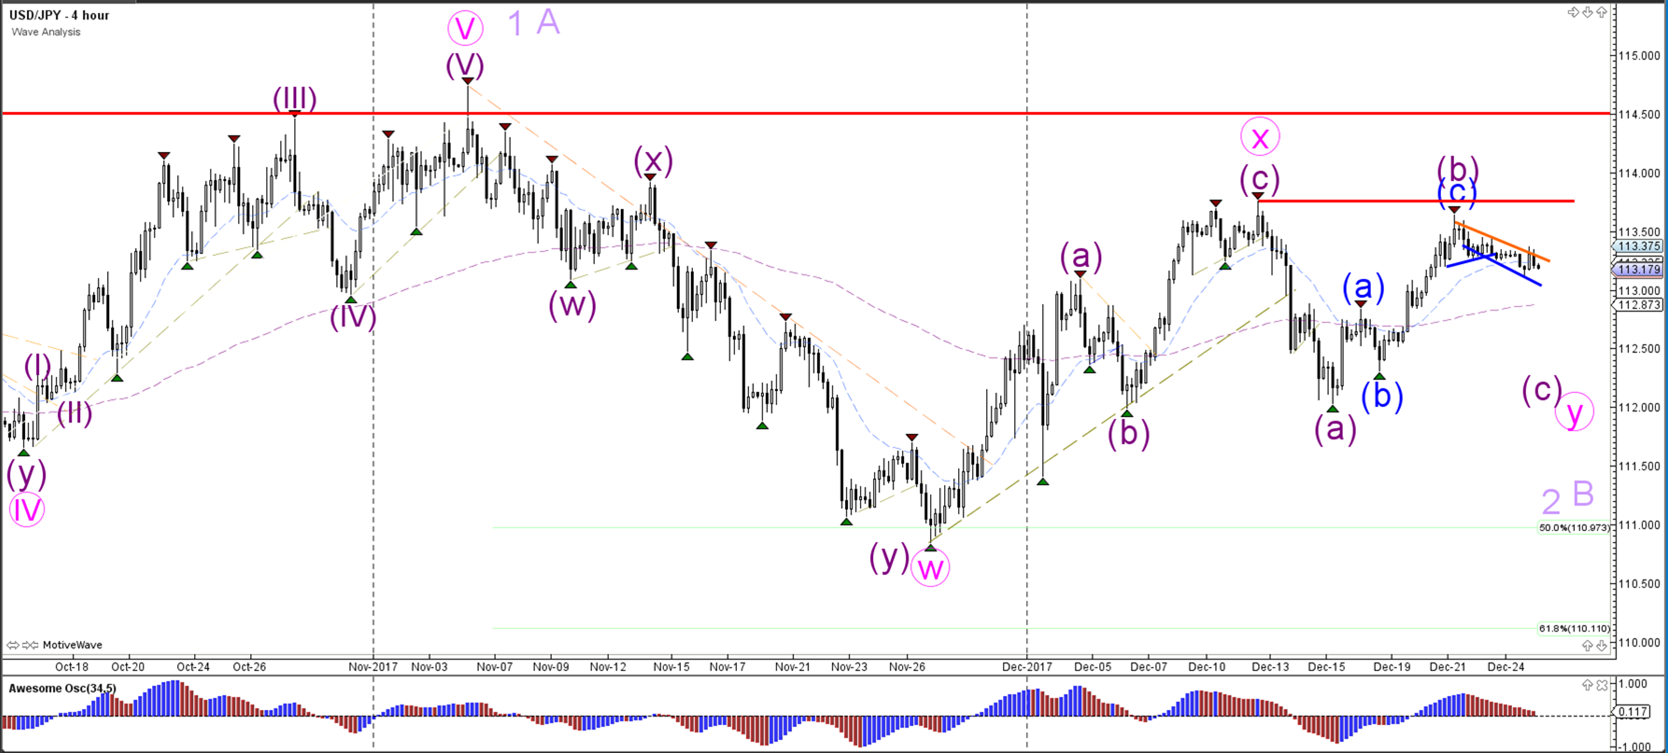
The USD/JPY needs to break below support before a bearish reversal becomes more likely whereas a break above resistance could indicate and uptrend continuation.
1 hour
(Click on image to enlarge)
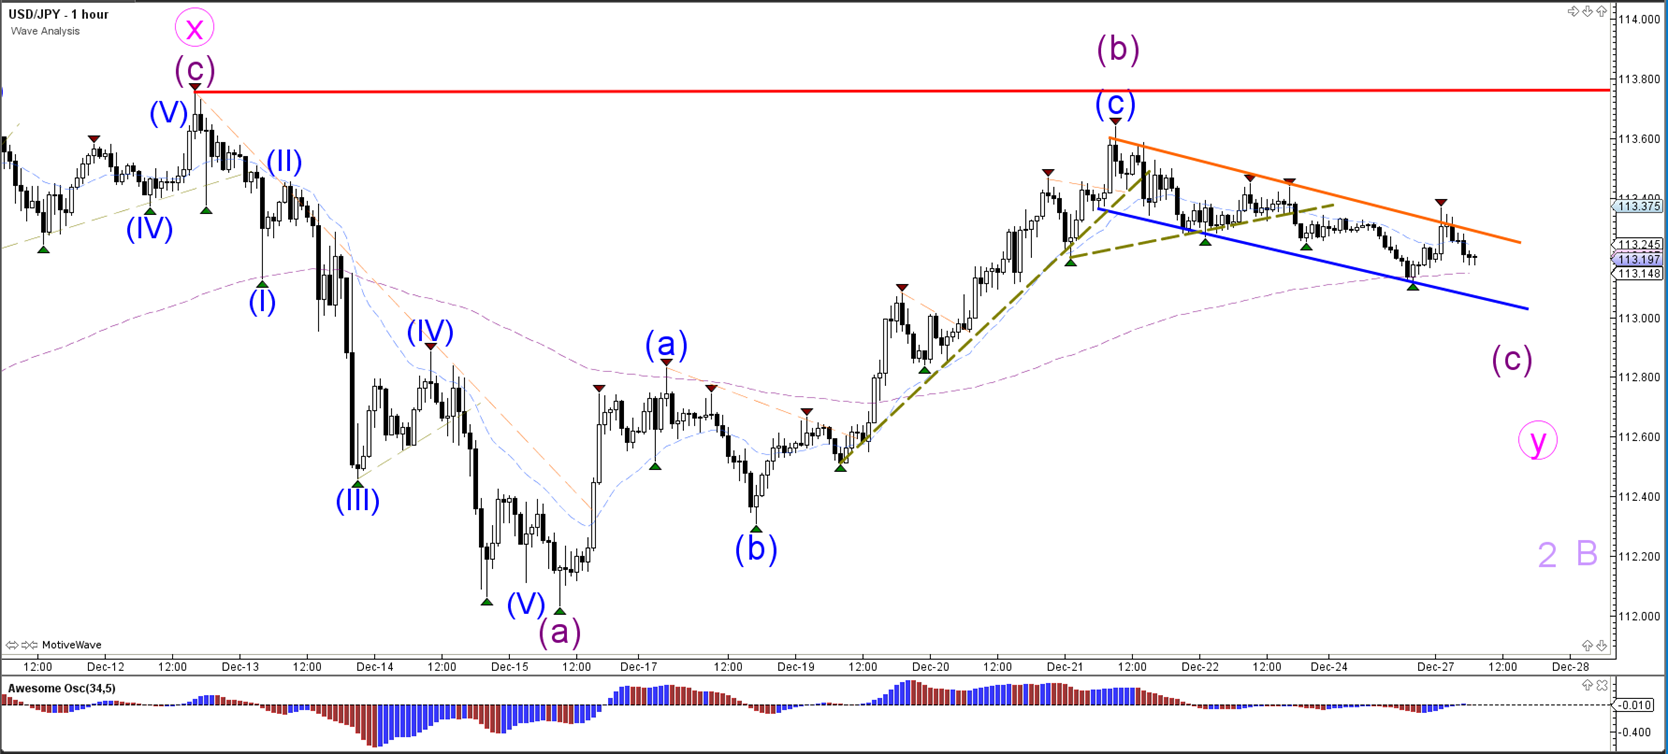
The USD/JPY is facing important and critical support (blue) and resistance (red) trend lines.



Comments
Log in or sign up to join the conversation.