
The EUR/USD is testing a key 38.2% Fibonacci level on the daily chart. A bullish bounce did take place at the 23.6% Fib. Will the next Fib also act as support?
This article will review price patterns and the potential for a bullish reversal to take place.
Price Charts and Technical Analysis
(Click on image to enlarge)
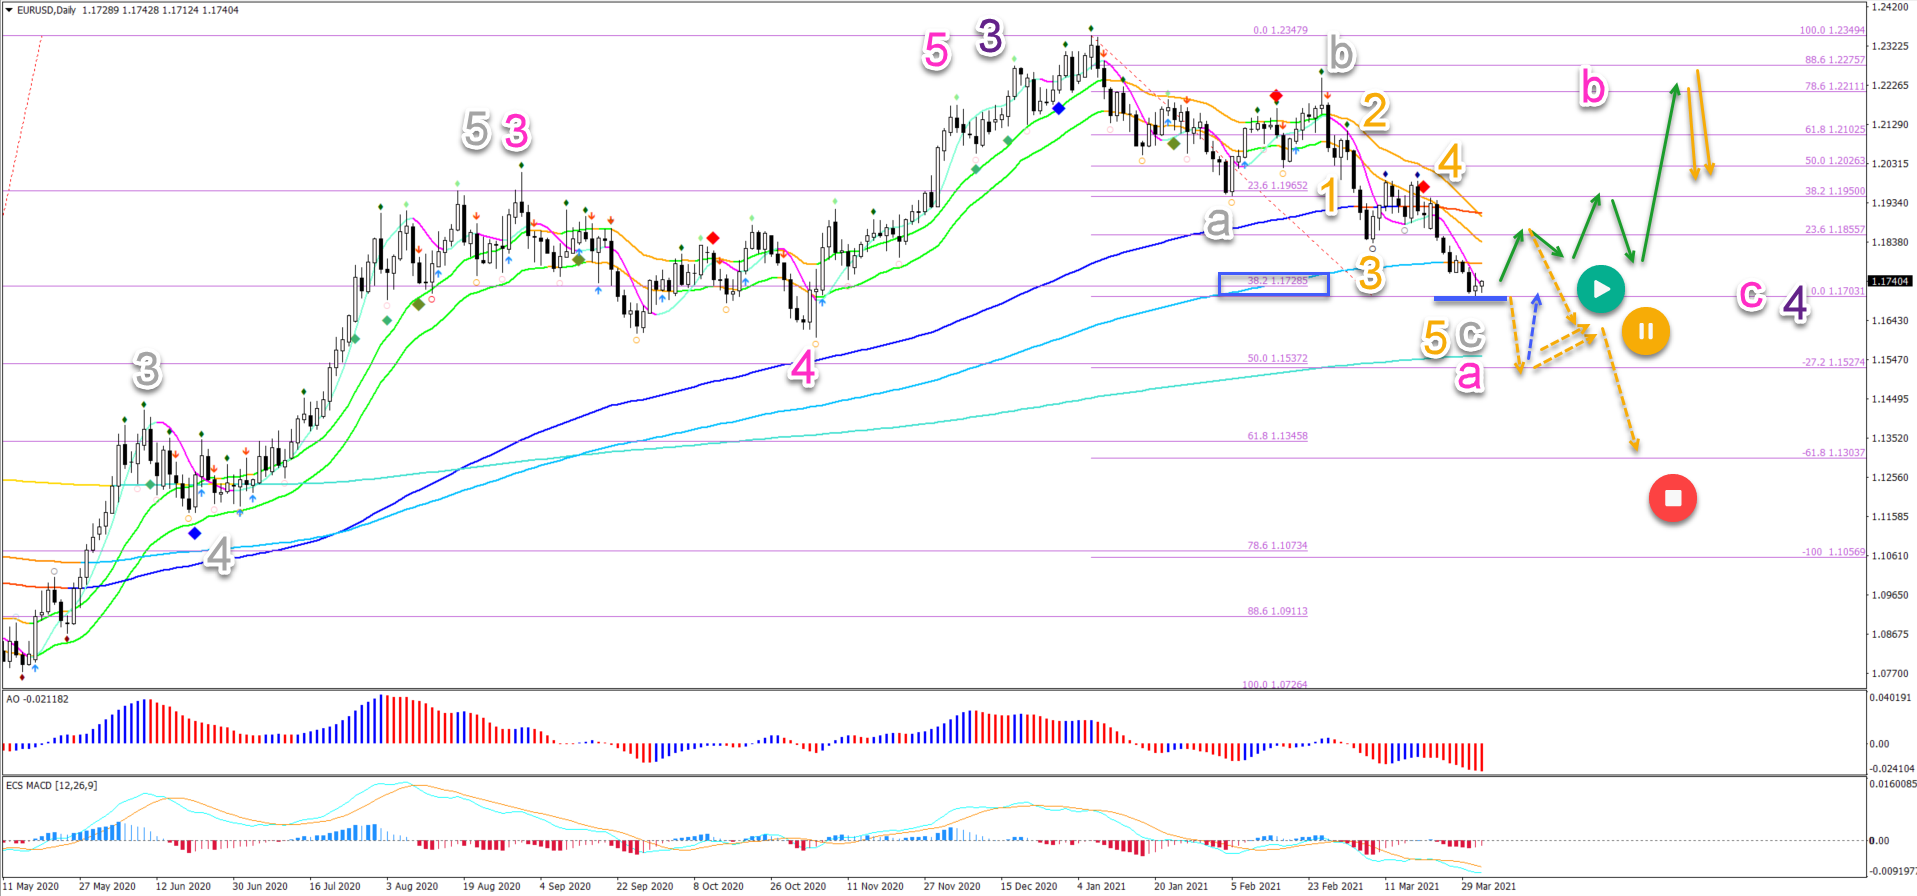
The EUR/USD seems to be completing a bearish ABC (grey) pattern at the 38.2% Fibonacci level (blue box). We expect the Fib to act as support and create a bullish move, either a small correction or a larger reversal:
- A bullish reversal (green arrows) could take place if price action is able to break above the 21 ema zone on the daily chart.
- The main upside targets are the deep Fibonacci retracement levels at the 78.6%, 88.6% and previous top. A bearish reversal back down is expected there due to the larger ABC (pink) pattern in wave 4 (purple).
- A strong bearish bounce at the 21 ema zone or an immediate breakout below the 38.2% Fib indicates more downside pressure (orange dotted arrows). In that case, price could decline towards the 50% and 61.8% Fibonacci levels.
- The wave 4 pattern, however, becomes less likely if price action breaks below the 38.2% Fib. It could indicate a downtrend instead.
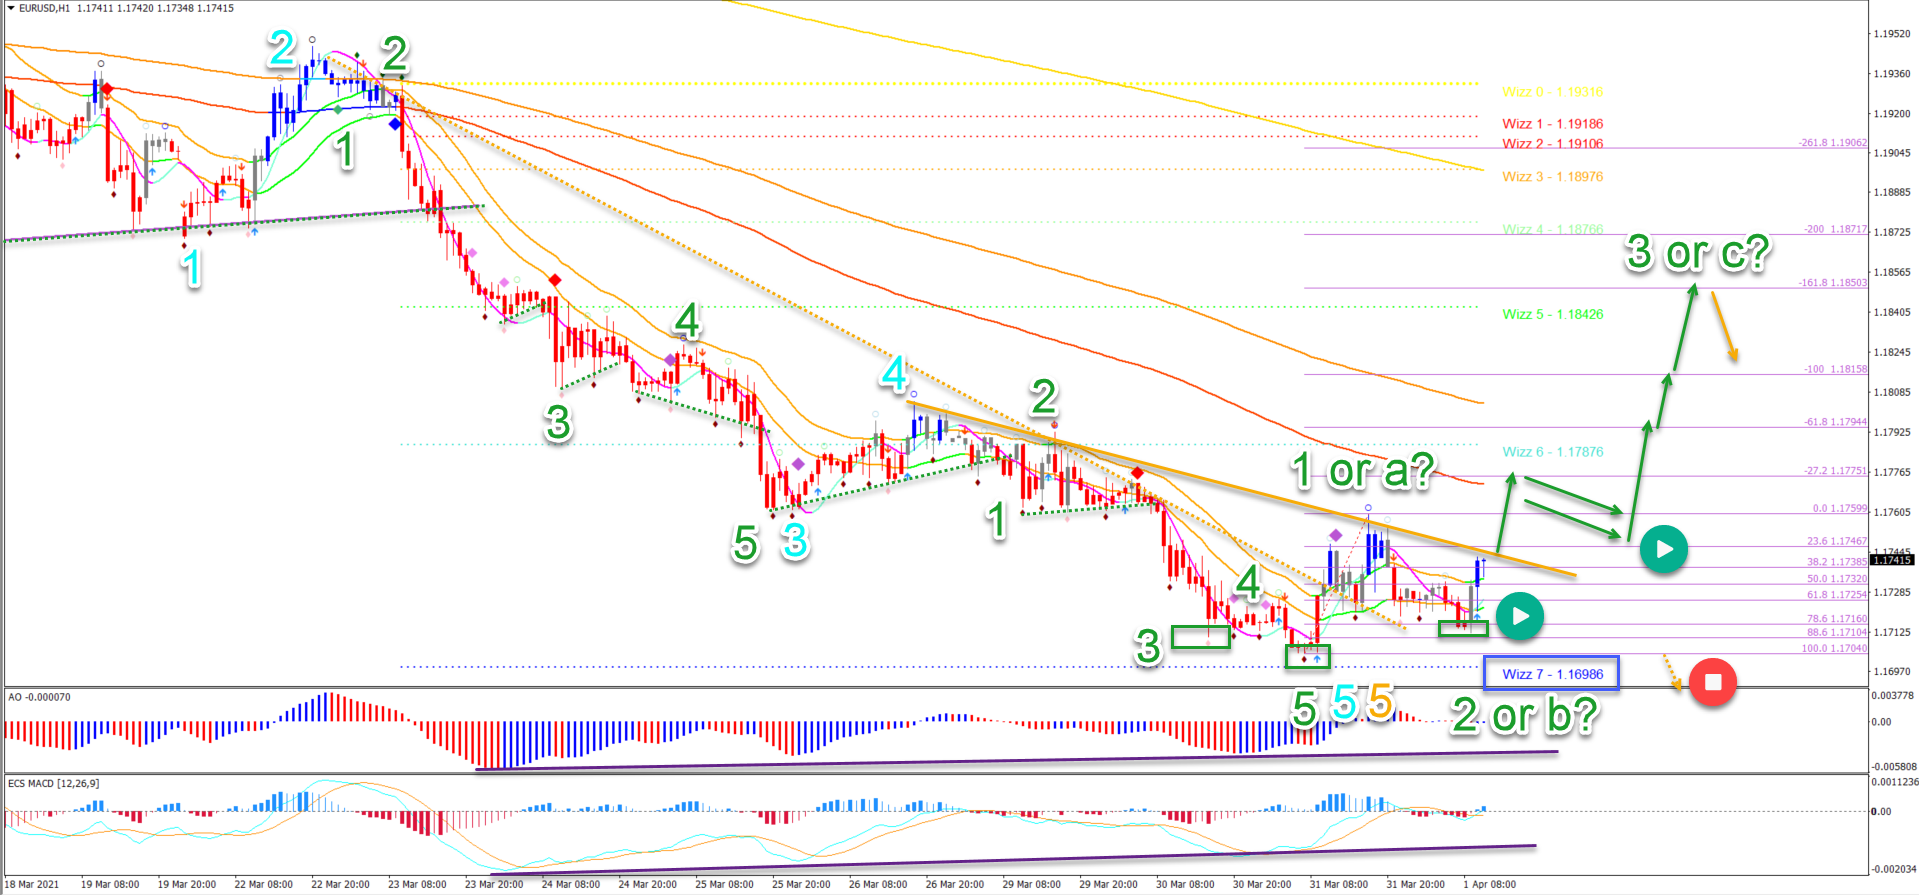
On the 1 hour chart, there are signs that a bullish reversal could take place. But of course, a reversal is always risky as the trend could be strong enough to continue. Here are the main factors:
- A divergence pattern (purple lines) is visible between the bottoms, which is indicating that the bears are losing steam.
- A potential inverted head and shoulders reversal chart pattern could emerge (green boxes). A break (green arrow) above the neck line and resistance (orange) is needed to confirm that reversal pattern.
- Price action has reached a strong support zone with the 38.2% Fib from the daily chart, the Wizz 7 level and the 1.11750 round level zone.
- Although price action has already closed above the 21 ema zone for the second time, a bullish breakout (green arrows) above the resistance (orange line) could confirm the reversal.
- The upside could either be an ABC or 123 pattern. This depends on how strong the price moves up. The main target for the wave C is the -61.8% Fib at 1.17944 and the wave 3 is at the -161.8% Fib target at 1.18950.
(Click on image to enlarge)


Comments
Log in or sign up to join the conversation.