

EUR/USD
4 hour
(Click on image to enlarge)
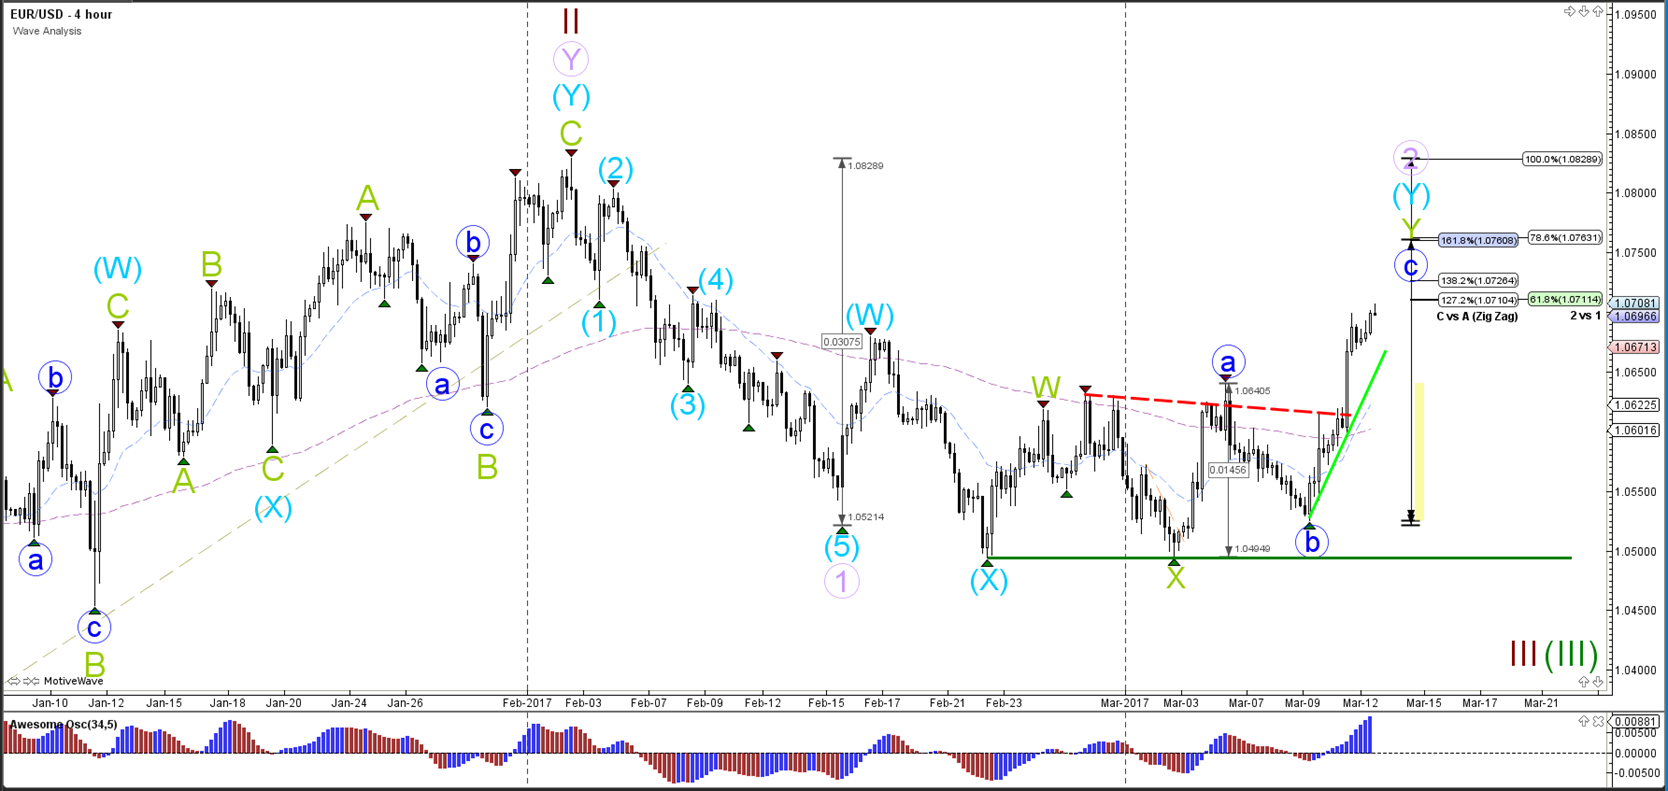
The EUR/USD broke above the resistance trend line (dotted red) of the consolidation zone (red/green) and has reached the 61.8% Fibonacci retracement level of wave 2 (purple). Any of the Fibonacci levels could be a resistance spot but a break above the 100% level invalidates the wave 1-2 structure.
1 hour
(Click on image to enlarge)
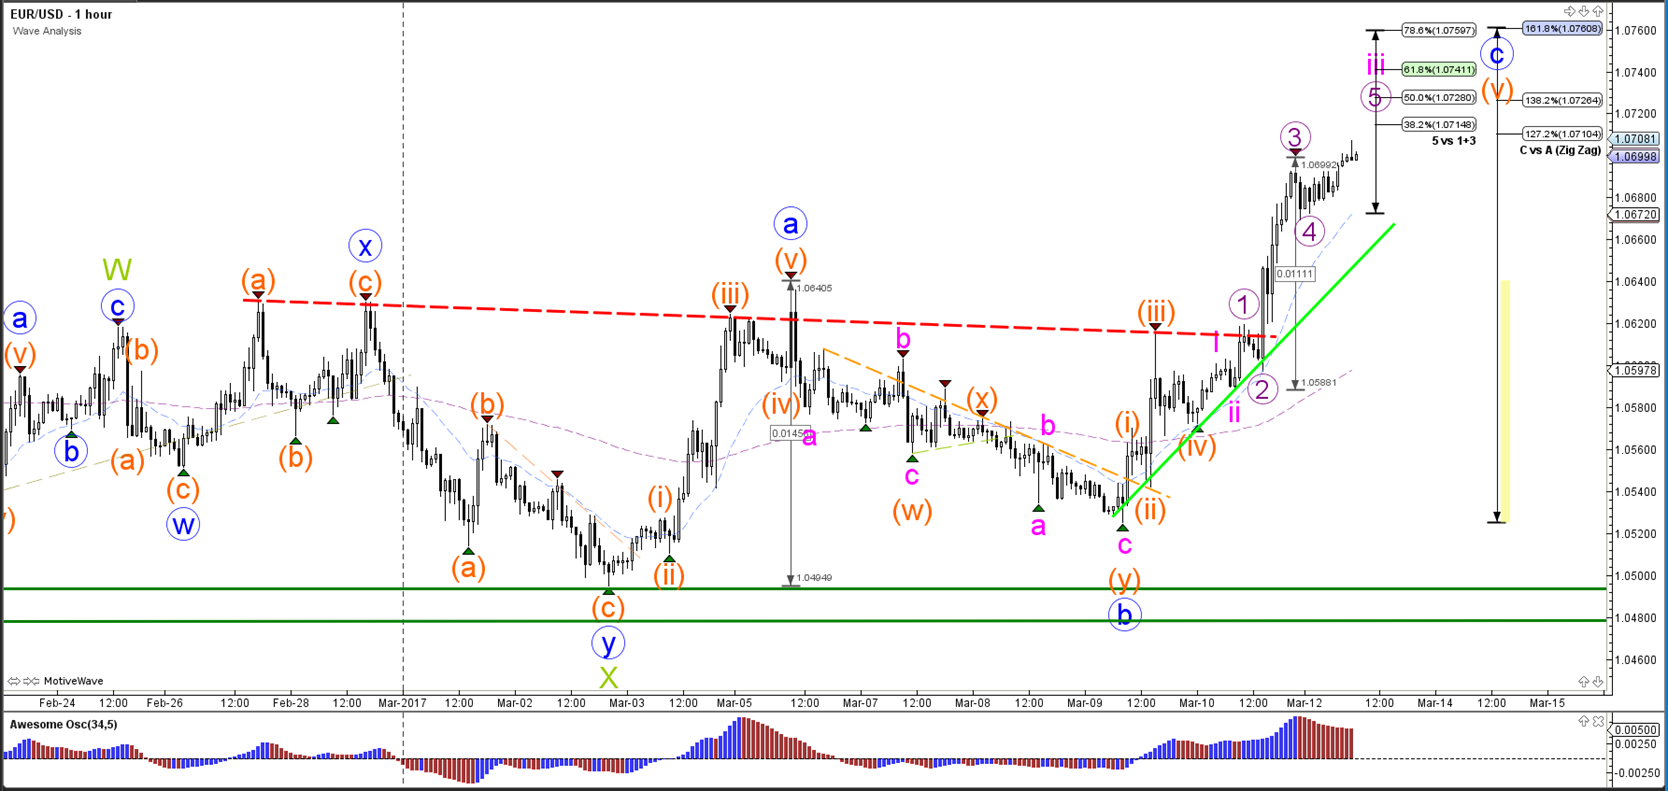
The EUR/USD is showing strong momentum in the bullish 5th wave (orange) within wave C (blue). The momentum could indicate a potential for wave 4 (pink) and another wave 5 (pink) within wave 5 (orange).
GBP/USD
4 hour
(Click on image to enlarge)
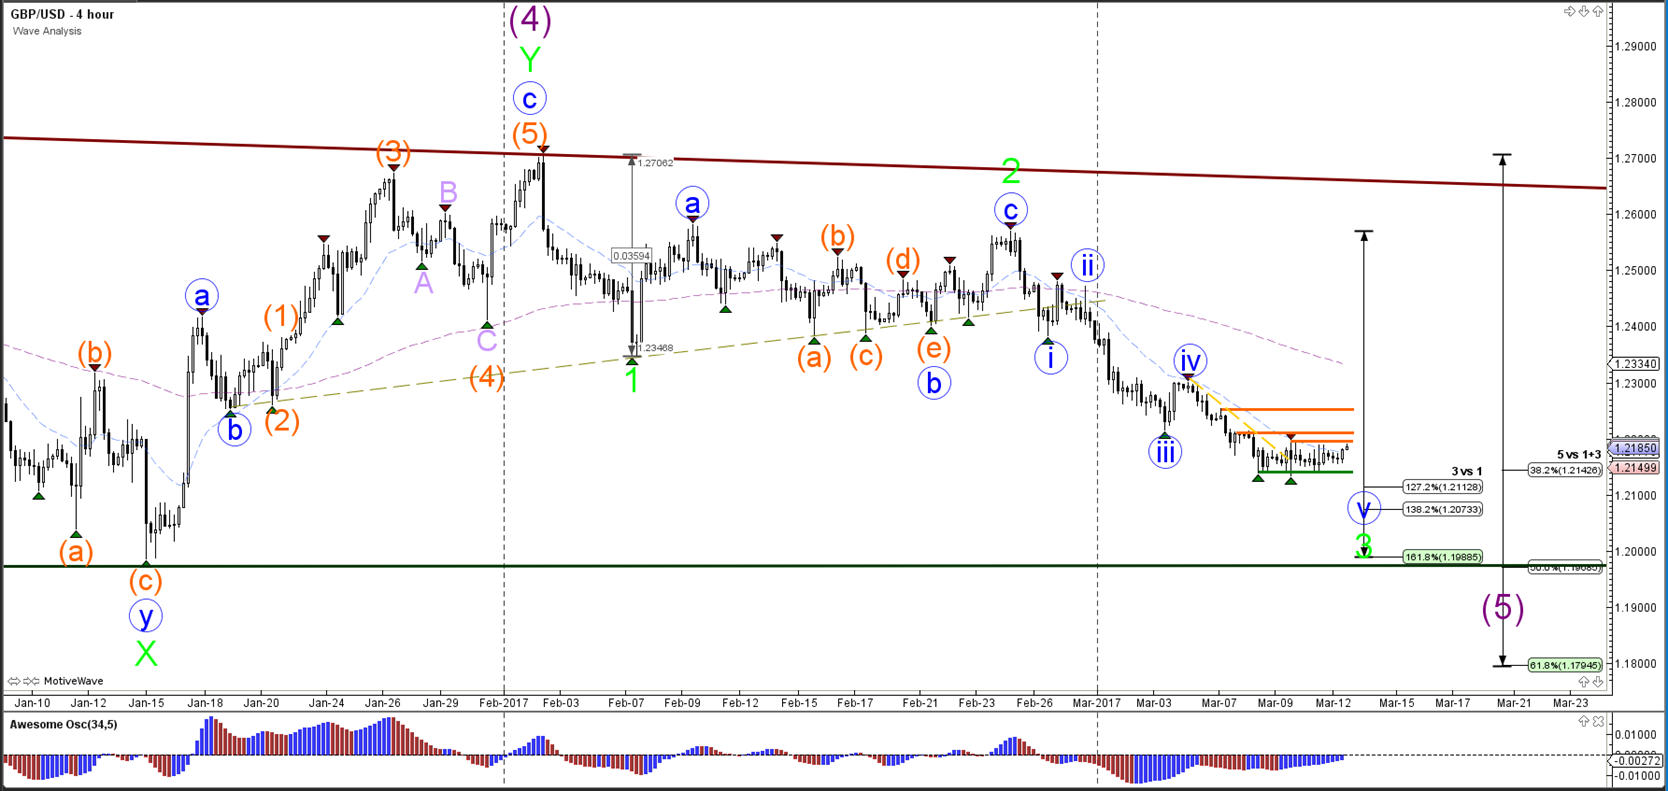
The GBP/USD is moving sideways in a consolidation zone and price has both horizontal support (orange) and resistance (orange) nearby. A bearish break below support (green) could see price move towards 1.20 which is a psychological round level, previous bottom (green) and 161.8% Fibonacci target.
1 hour
(Click on image to enlarge)
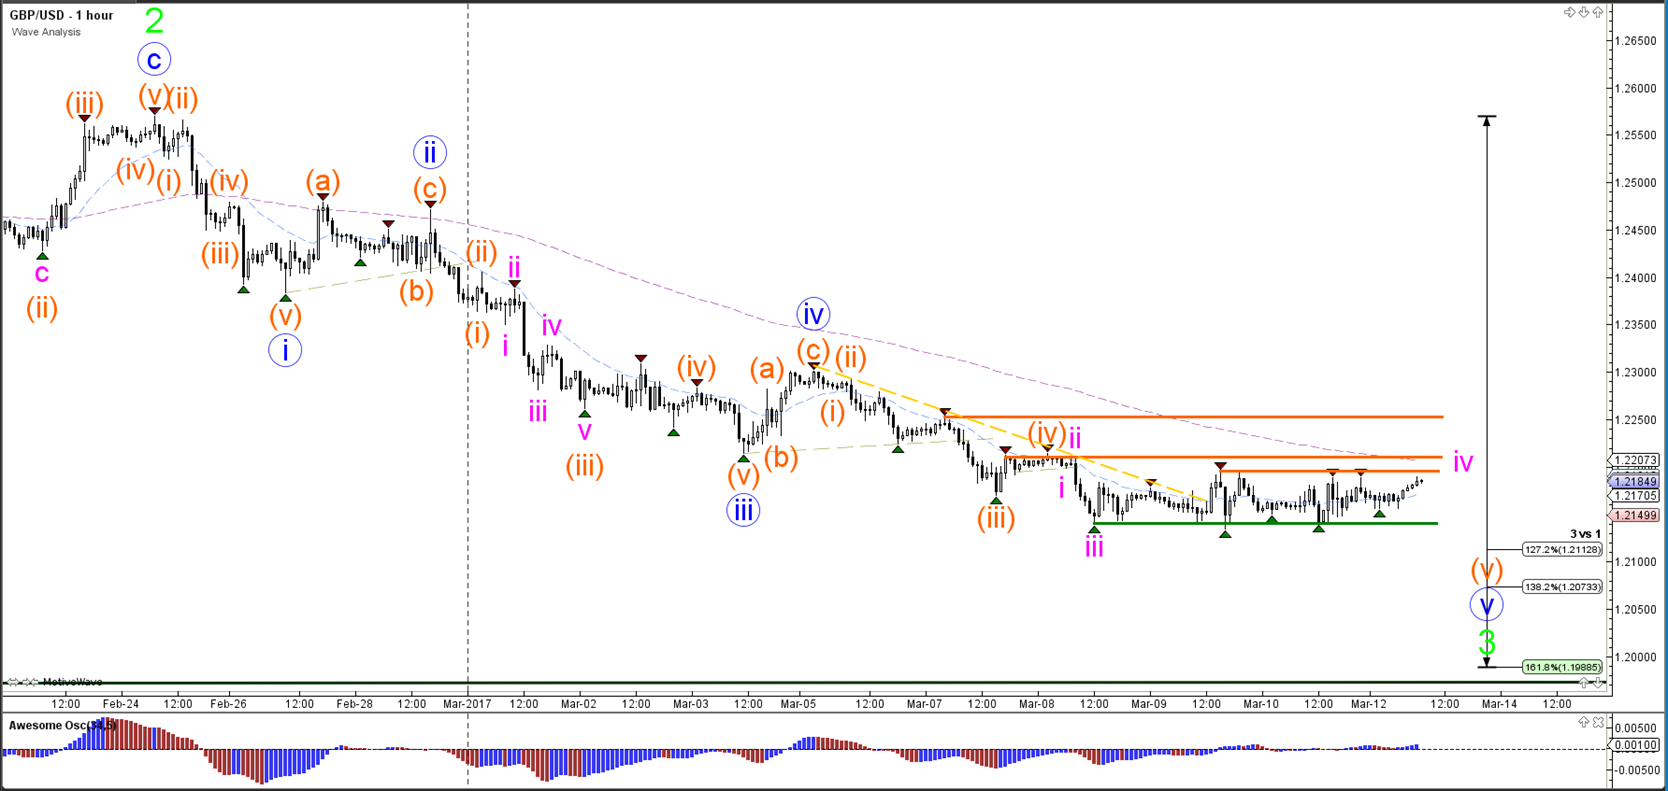
The GBP/USD remains bearish in my view as long as price stays below horizontal resistance levels (orange). The divergence between the bottoms could indicate that a bearish break of support (green) might lack strength. A break above resistance (orange) invalidates the wave 4 (pink) correction.
USD/JPY
4 hour
(Click on image to enlarge)
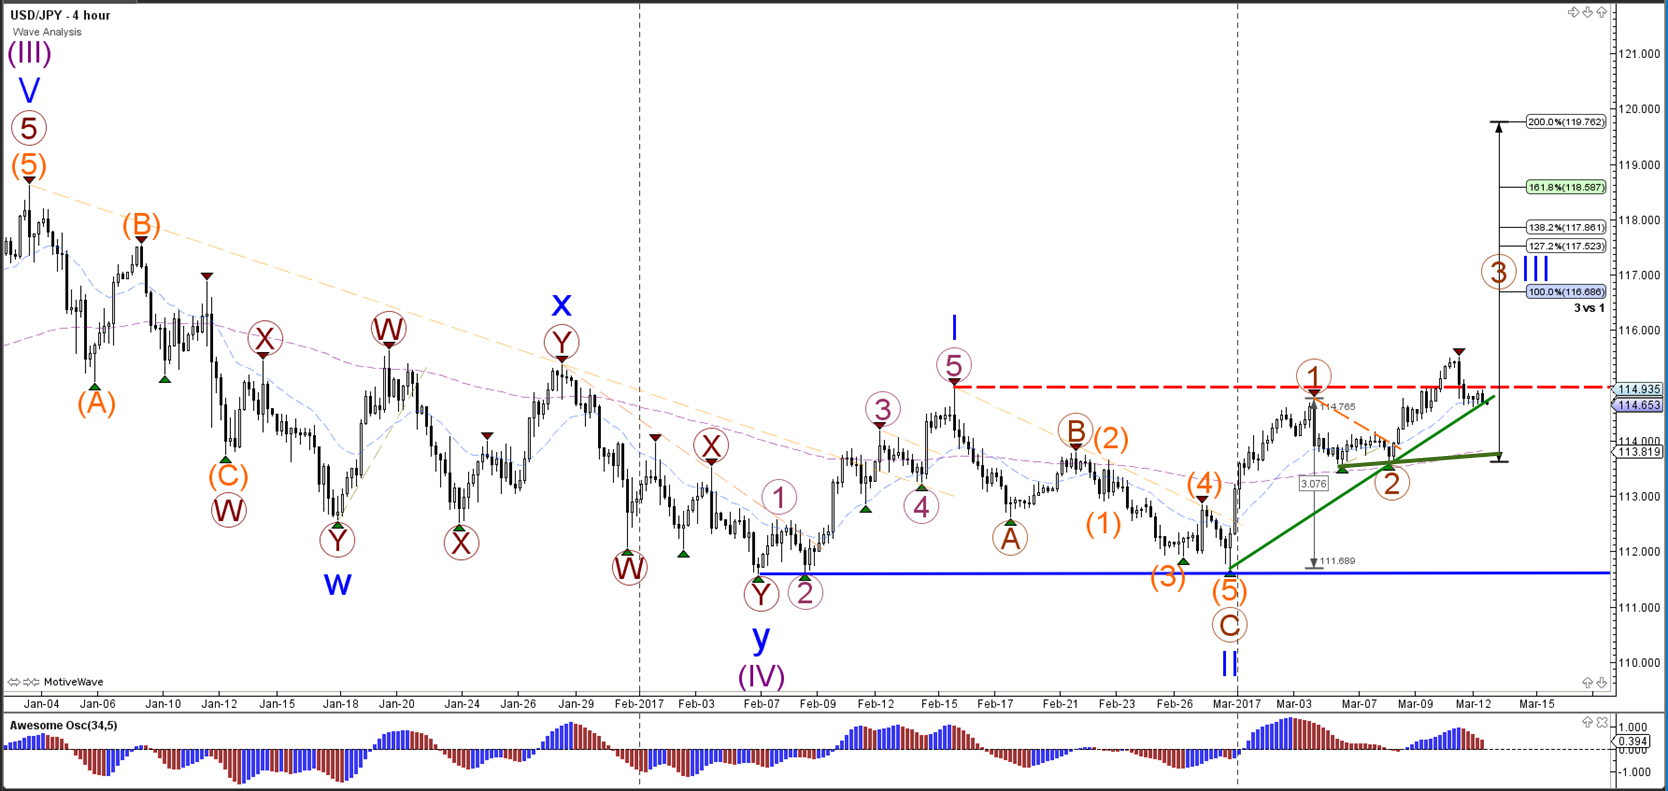
The USD/JPY broke above the resistance top (dotted red) of the wave 1 (blue) but momentum is lacking so far and price has retraced back below the broken resistance point (dotted red). Price could be retracing as long as price stays above support (green lines).
1 hour
(Click on image to enlarge)
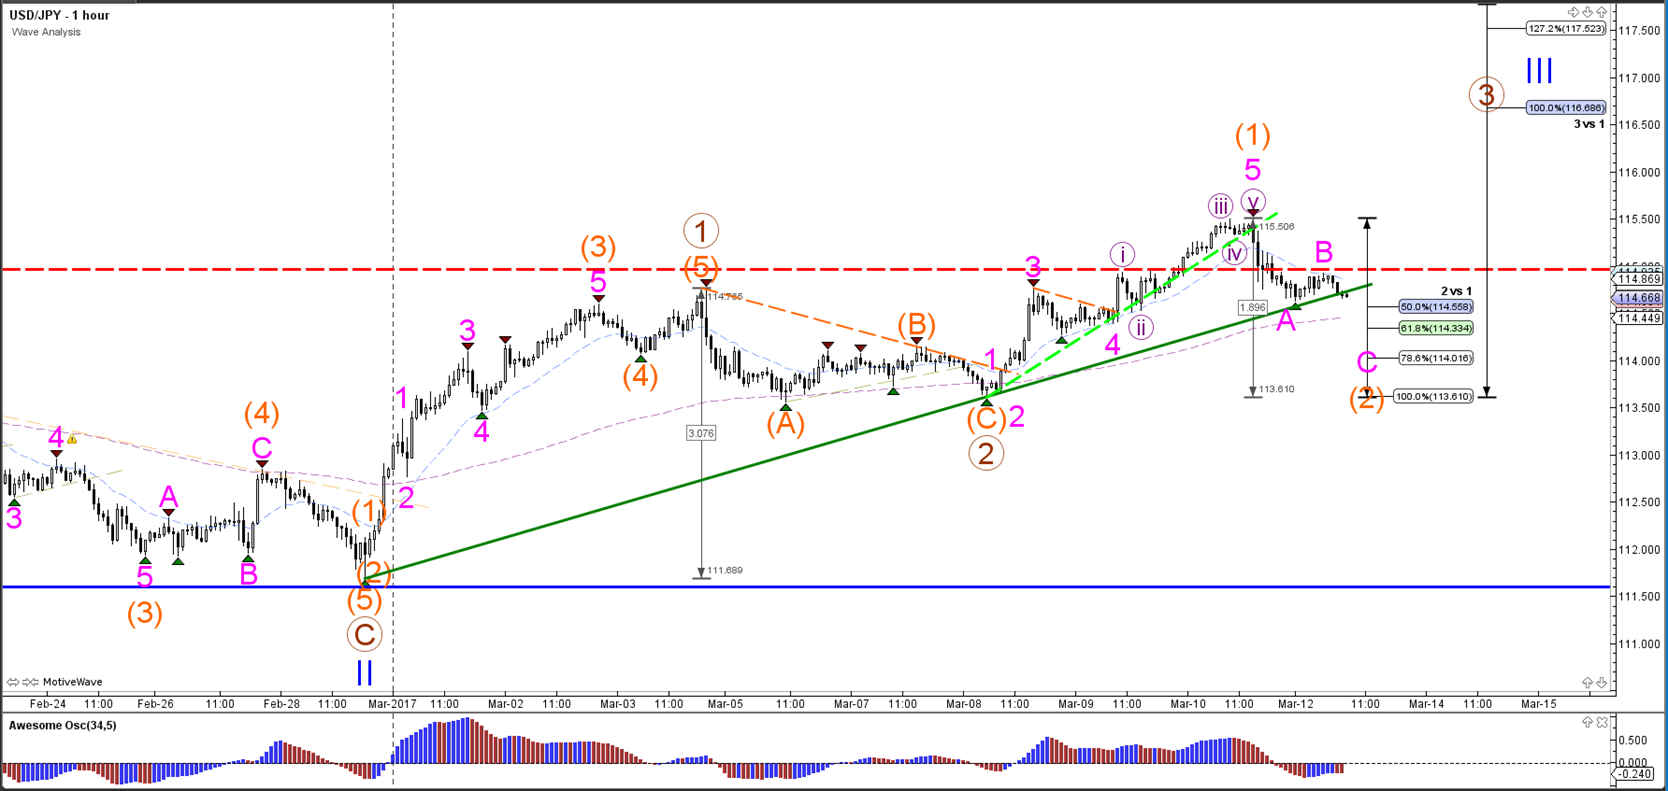
The USD/JPY could be building a wave 1-2 (orange) but a break below the 100% Fibonacci level invalidates wave 2 (orange).



Comments
Log in or sign up to join the conversation.